
SkudoCloud delivers the full capabilities of the SKUDONET platform through a usage-based Software-as-a-Service (SaaS) model. This approach removes the operational burden from the customer, allowing teams to focus solely on configuration and optimization—without concerns about infrastructure, maintenance, or availability.
High Availability and SLA Commitment
All network appliances deployed through SkudoCloud are architected with multi-layer high availability, encompassing:
-
- Resource redundancy (CPU, RAM, storage)
- Resource redundancy (CPU, RAM, storage)
- Real-time monitoring and health checks
If any component is detected to be offline or unstable, SkudoCloud automatically triggers its internal recovery and mitigation protocols. These systems are designed to uphold a 99.99% SLA-backed uptime, ensuring uninterrupted delivery of your services.
Accessing and Managing Load Balancers
To manage your deployed load balancers:
- Log into SkudoCloud
- From the left-hand menu, navigate to:
Manage > Load Balancer
This view will display a complete list of provisioned network devices, including:
- Load balancer name
- Assigned public IP address
- Operational status (ACTIVE, MAINTENANCE, etc.)
Accessing Device Configuration
To manage a specific load balancer:
- Click the gear icon at the end of the row corresponding to a device in ACTIVE state.This opens the device action panel.

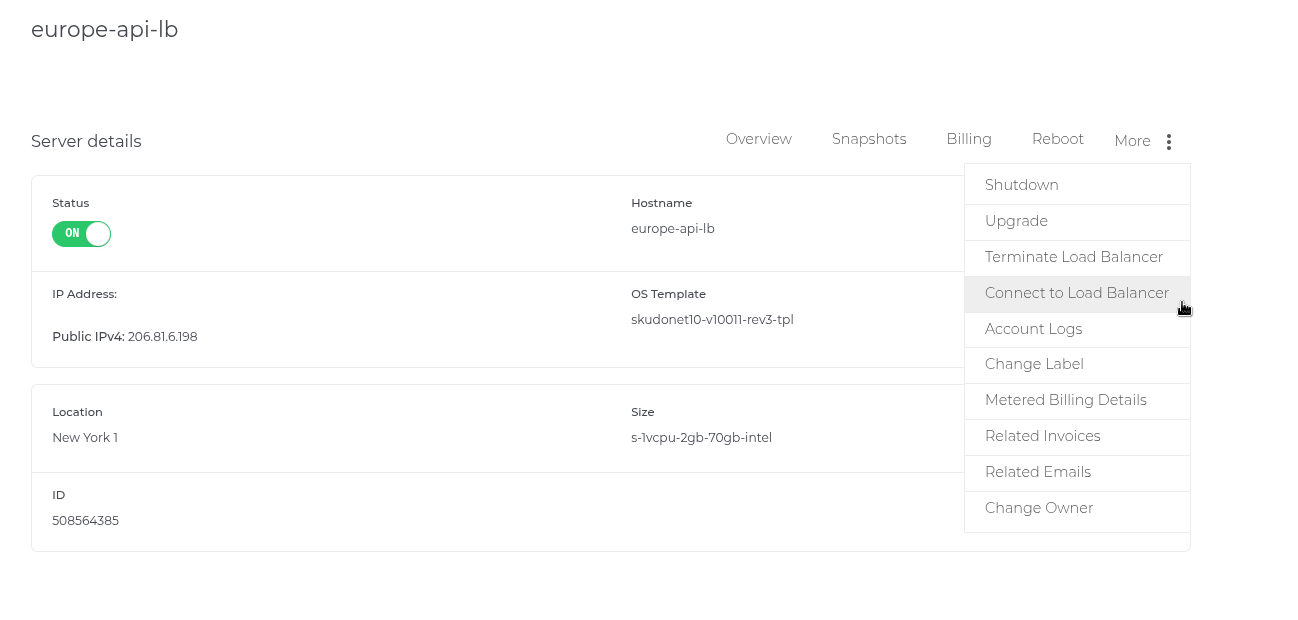
- At the top right corner of the panel, you will see a menu labeled More Options:
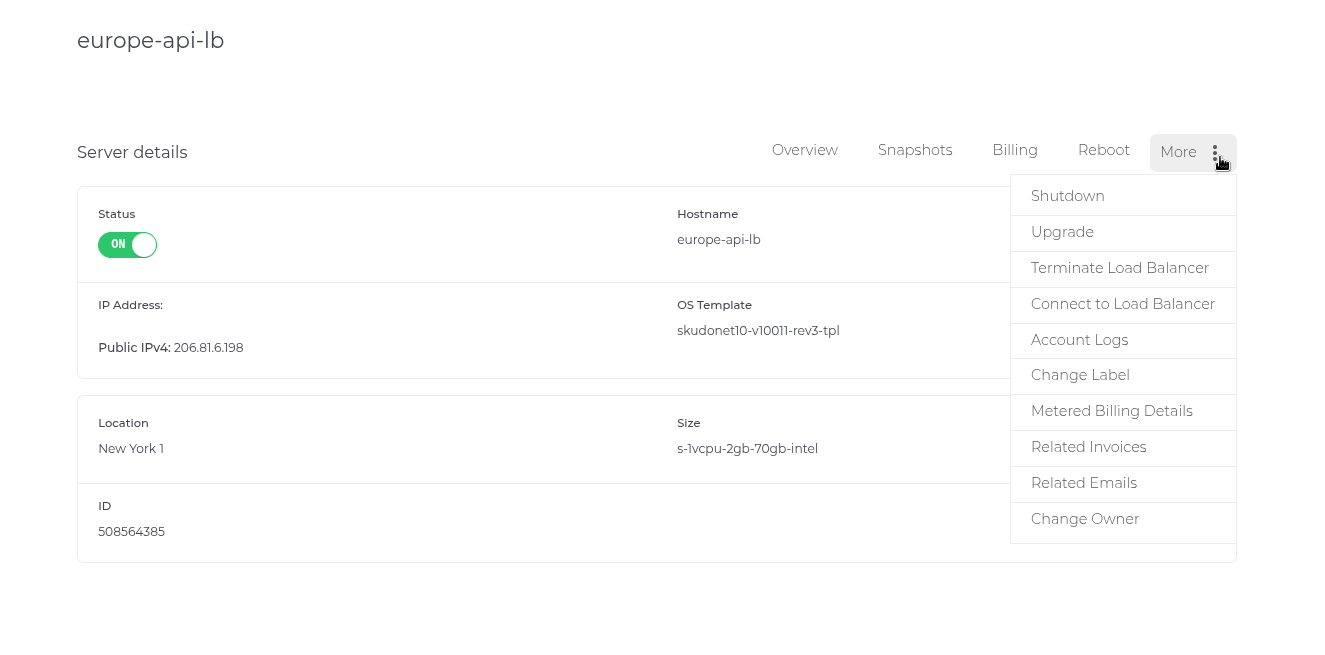
Clicking “Connect to Load Balancer” establishes a direct interface with the virtual appliance.
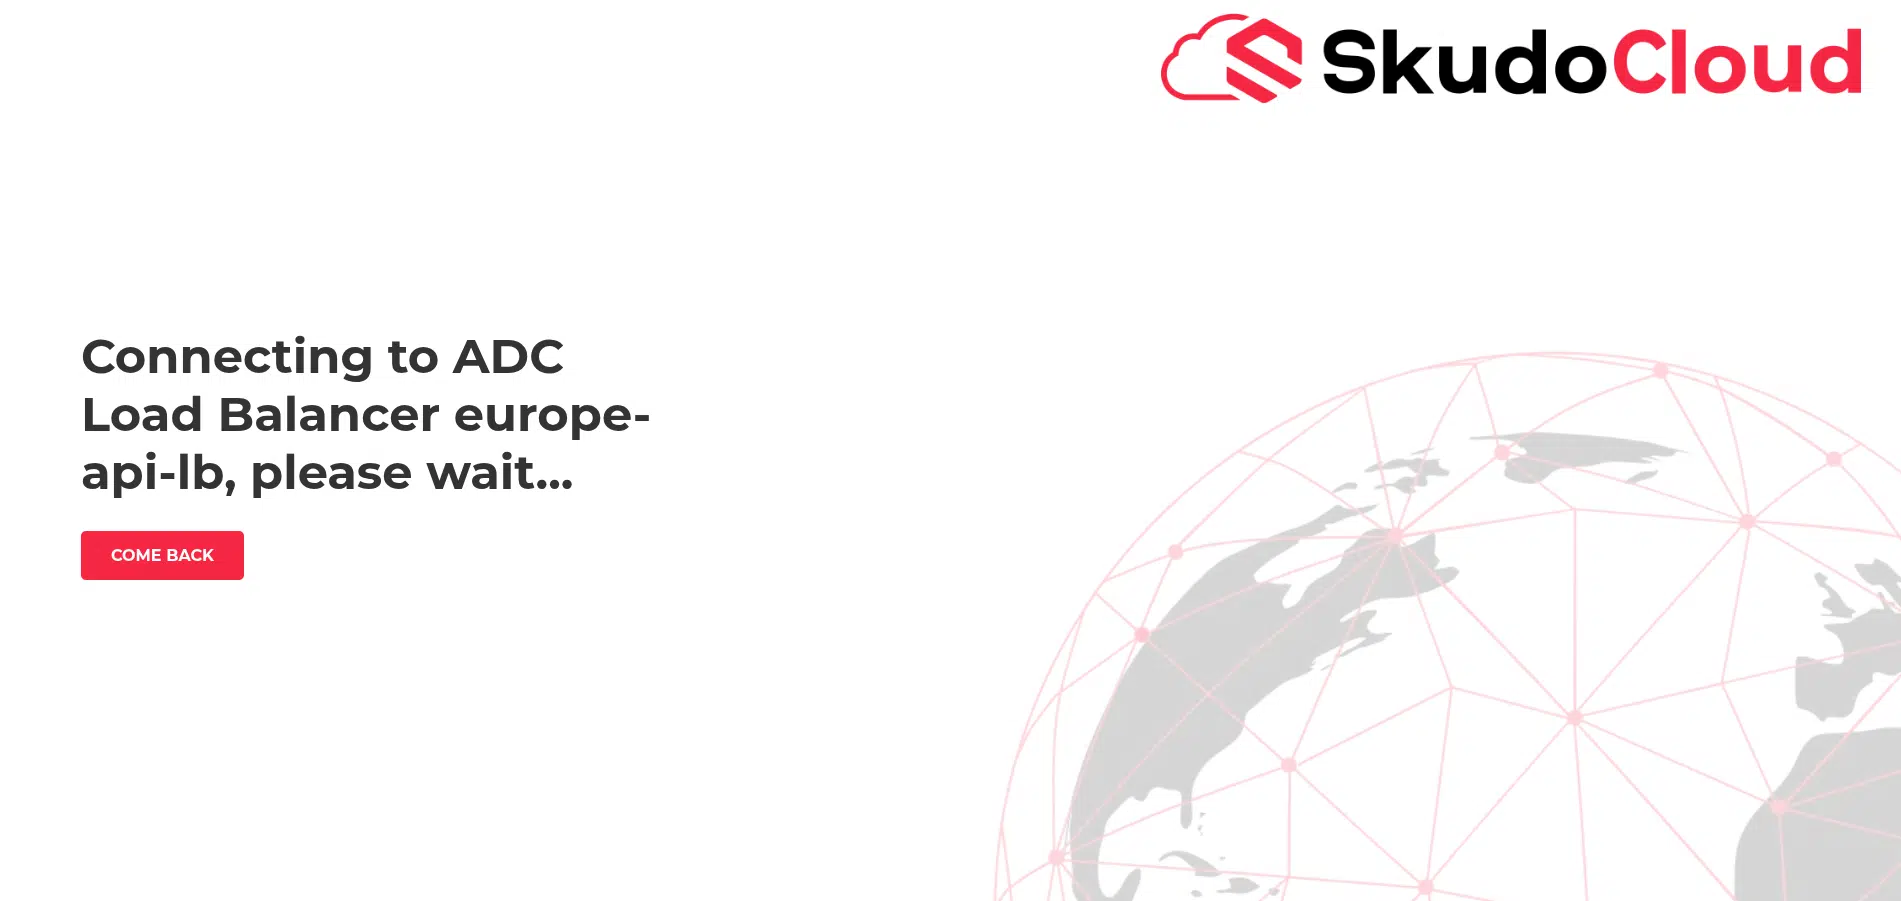
Once connected, the panel dynamically updates to reveal all available configuration options, and the view is changed to the available configuration for the selected Load Balancer.
Load Balancer sections
SkudoCloud is built on the latest version of the SKUDONET platform. As such, all load balancer functionalities are fully compatible with the SkudoNet v10 Administration Guide.
For in-depth technical information about:
- Load balancing methods
- Farm and backend configuration
- Security policies and IPDS modules
You can access more extended help and contextual help directly within the platform. Look for the help icon (ℹ️) at the top-right corner of every page. Clicking it will open the extended knowledge base specific to that section.
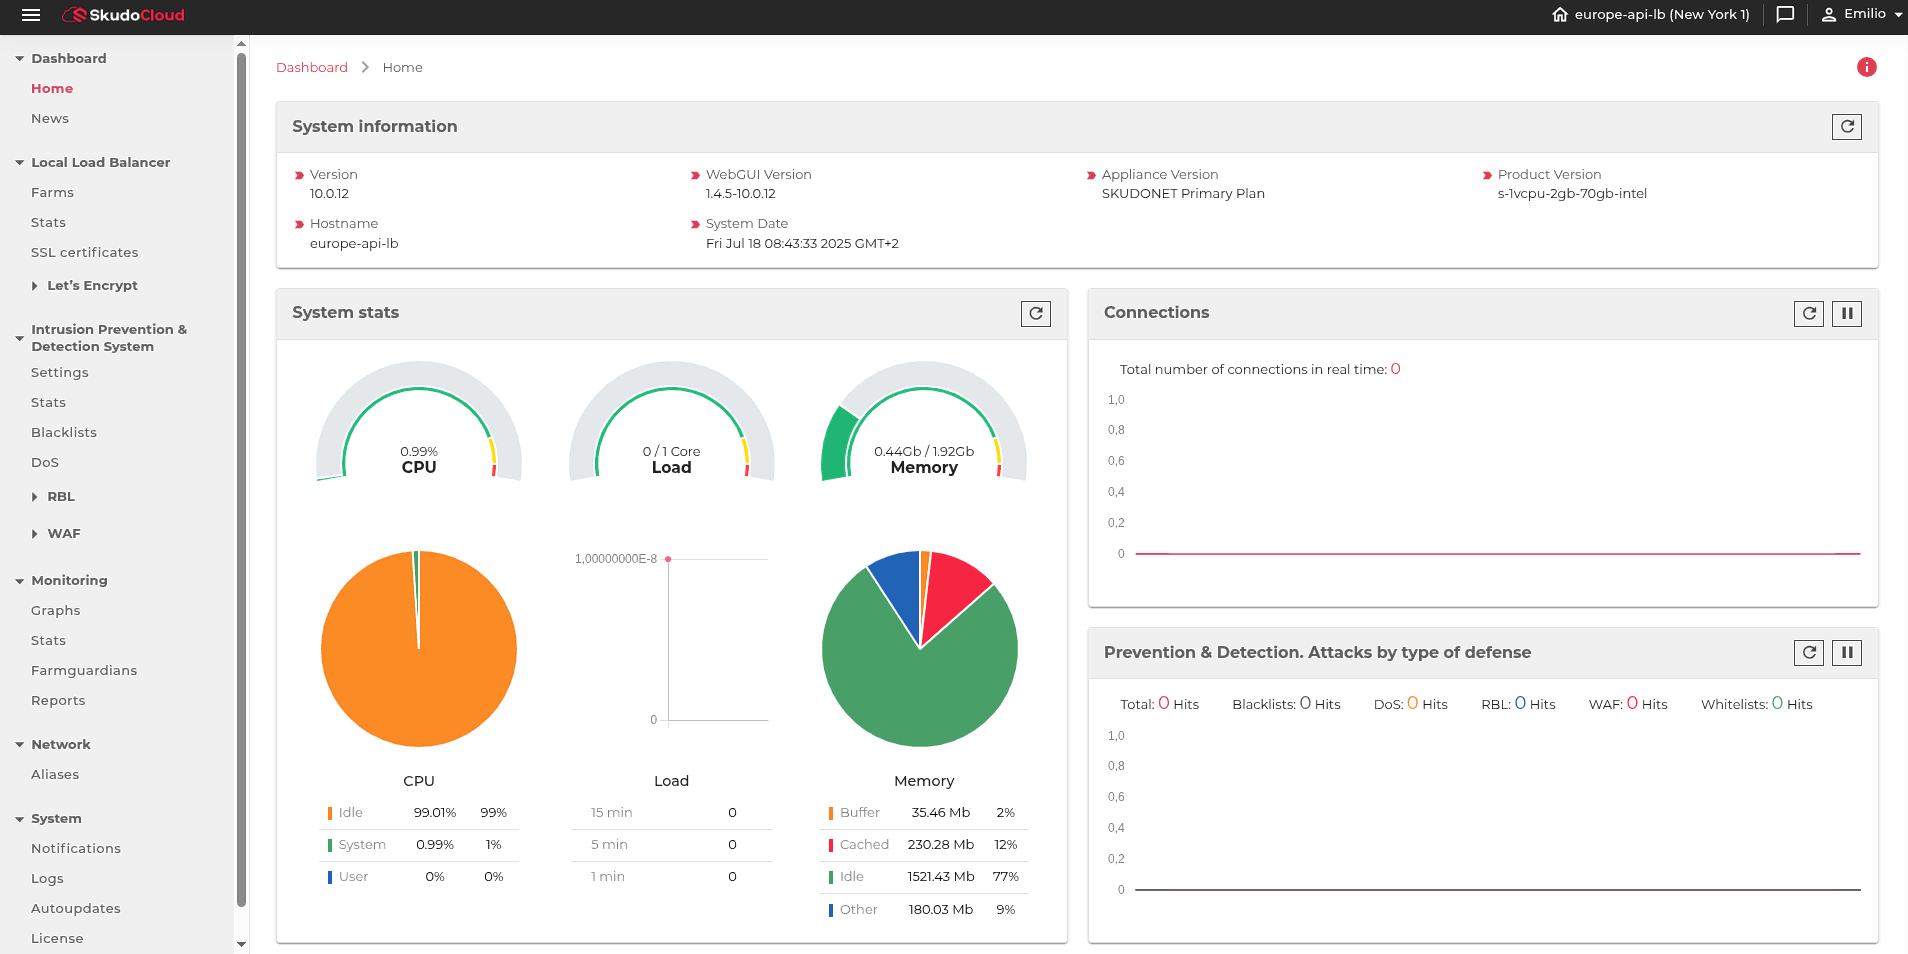
The following outlines each section of the navigation panel in a connected SkudoCloud Load Balancer, including functionality details and cross-references to official documentation.
1. Dashboard
Home
Provides an overview of system status, including:
- Load balancer farms health (UP/DOWN)
- Resource usage (CPU, RAM, traffic)
📘 Official Docs
News
Displays platform announcements such as:
- Security advisories
- Software releases
- Maintenance updates
2. Local Load Balancer (LSLB)
Farms
Create and manage load balancing farms for L4/L7 traffic:
- Supported protocols: HTTP/S, TCP, UDP
- Load balancing algorithms: Round Robin, Least Connections, etc.
- Backend configuration: priorities, weights, health checks
LSLB Farms – Setup
Stats
Live statistics per farm:
- Current connections
- Backend status
- Error rates and service health
LSLB Statistics
SSL Certificates
Manages system-wide SSL/TLS certificates for both the GUI and backend services.
Key features:
- Upload custom certificates (PEM, CRT/KEY formats)
- Generate CSR (Certificate Signing Requests)
- Support for Let’s Encrypt (automated renewal and wildcards)
- Apply certificates to Farms and Services.
System – SSL Certificates
Let’s Encrypt
Automated SSL certificate issuance and renewal for public domains.
SSL Certificates
3. Intrusion Prevention & Detection System (IPDS)
(This module is enabled if the selected SkudoCloud plan includes this option)
Settings
Manage IPDS modules and security profiles:
- Enable/disable threat filters
- Schedule to download SKUDONET custom rule sets.
📘 IPDS Settings
Stats
Displays real-time intrusion data:
- Detected threats by type
- Blocked source IPs
IPDS Statistics
Blacklists
Manage dynamic or static blacklists (IP, FQDN, country-based, ASN).
Blacklist Configuration
DoS
Mitigation module against DoS/DDoS attacks:
- Rate limiting
- Pattern-based traffic filtering
DoS Protection
RBL
Uses external reputation services (e.g. Spamhaus) to block low-trust IPs.
RBL Settings
WAF
Web Application Firewall based on ModSecurity:
- Manages .conf, .data, .lua rules
- Protects against XSS, SQLi, RFI, etc.
WAF File Management
4. Monitoring
Graphs
Real-time visualizations:
- Network traffic
- Connection to farms
- CPU/memory usage
Monitoring Graphs
Stats
Detailed numeric stats across components (load balancers, NICs, services).
Monitoring Stats
Farmguardian
Advanced health checks per backend:
- Script-based probes (HTTP, ping, SSL)
Farmguardian Setup
Reports
Generates detailed system activity reports in CSV/PDF.
Monitoring Reports<
5. Network
Aliases
Manages virtual IPs assigned to physical or bonded interfaces.
Network Aliases
6. System
Notifications
Displays system-generated alerts, such as:
- Scheduled task outcomes
- Update availability
- Backends down/up
These help administrators stay aware of key events in real-time.
System – Notifications
Logs
Centralised logging of:
- User access
- Configuration changes
- Error messages
System Logs
Autoupdates
Configures automatic updates for both the OS and SkudoNet services.
Auto-Update Module
