
The following graphs show monitored data for IPDS attacks on the load balancer, with options for daily, weekly, monthly, and yearly views.
The Show Graphs section lets you choose a farm. The selected farm’s name will then appear as the graph title.
The graphs in the image below show the count for the selected Farm.
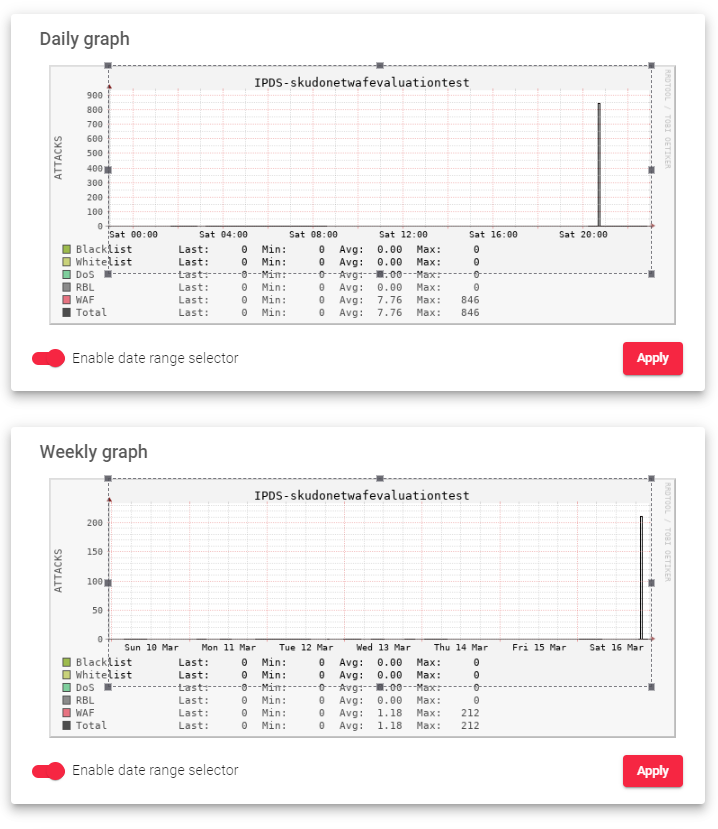
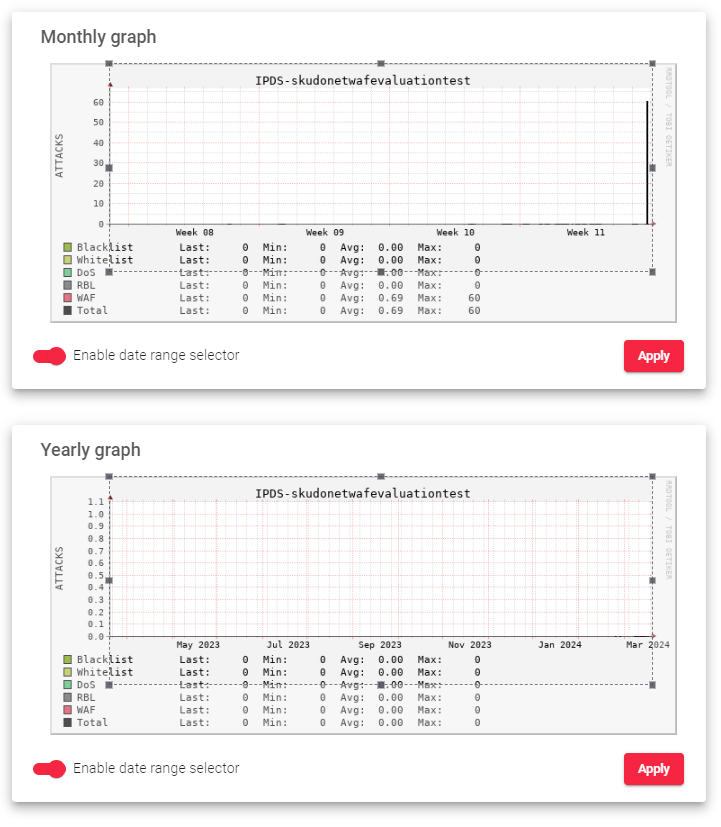
Here is a brief description of the graphs in the image above:
Y-Axis (Attacks): This shows the total number of IPDS attacks detected over time (hours, days, weeks, or months).
Data Categories:
- Blacklists: Tracks requests from blacklisted IP addresses by SKUDONET ADC.
- Whitelists: Shows allowed IP addresses accessing specific farms.
- DoS: Counts Denial-of-Service attacks, including Bogus TCP traffic.
- RBL: Tracks content or emails from known spammer IP addresses.
- WAF: Counts web application attacks, especially those listed in OWASP Top 10.
- Total: Represents the sum of all attack categories listed above.
Data Points:
- Last: Displays the most recent count for each IPDS block/attack type.
- Min: Shows the lowest count recorded for each IPDS block/attack type.
- Avg: Represents the average count for each IPDS block/attack type.
- Max: Indicates the highest count recorded for each IPDS block/attack type.
Enable date range selector: Users can enable a date range picker to view statistics for a specific timeframe.
