Contents
Dashboard | ZEVENET Community Edition 5.12
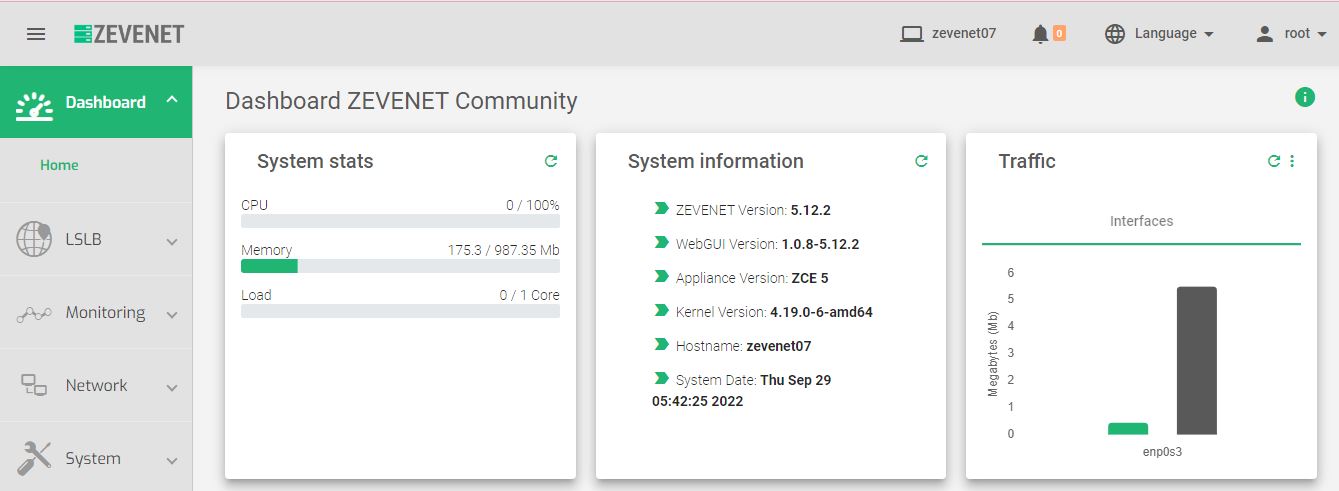
The dashboard shows an up-to-date status of the entire load balance appliance i.e. CPU and memory usage, the load, system information, farm status, e.t.c.
The dashboard has four main sections:
Professional Info
System Stats
Farms
Network Interfaces
Profesional Info
The upper section of the Dashboard shows Zevenet Professional services, Products, News, and Resources.
In this section, you’ll find several links to various Zevenet products. You will have access to each service and product.
In the news subsection, you’ll find the latest information about various channels. Additionally, the resources widget provides users with links to educative information and insights about Zevenet Community Edition.
System Status
The system status section shows general information about Nic interfaces, System Information, and system stats.
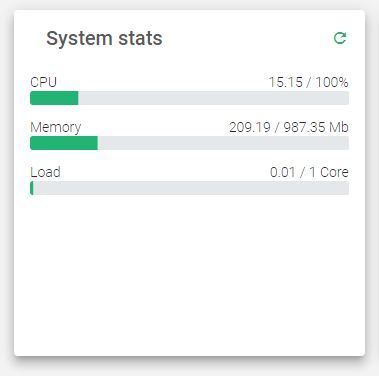
System Stats
CPU Usage. The green portion of the bar is a percentage measure of used CPU resources.
Memory Usage. The green portion of the bar is a percentage measure of used memory resources.
Load Usage. Indicates the number of cores loaded, the history and progression of the load in the whole appliance during the last 1, 5, and 15 minutes.
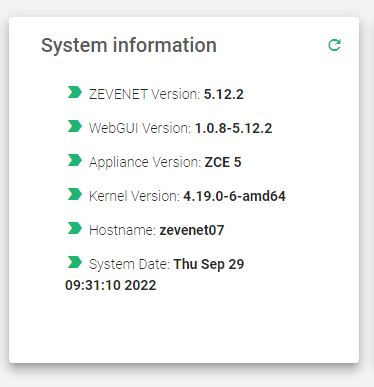
System Information
Basic information related to the appliance: ZEVENET Version, Appliance version and hypervisor, kernel version, hostname, and system date.
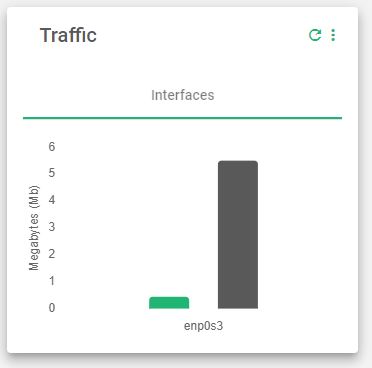
NIC Interfaces
The NIC subsection shows the network interfaces or adapters the servers at the farm are using.
The green bar shows the Inbound traffic and the grey one shows the Outbound traffic from the time the appliance was started.
Farms Info
This section contains information about available farms on ZEVENET appliances. Only the LSLB farm module is available in Community Edition 5.12.
The image below contains a list of farms as shown in ZEVENET CE 5.12.
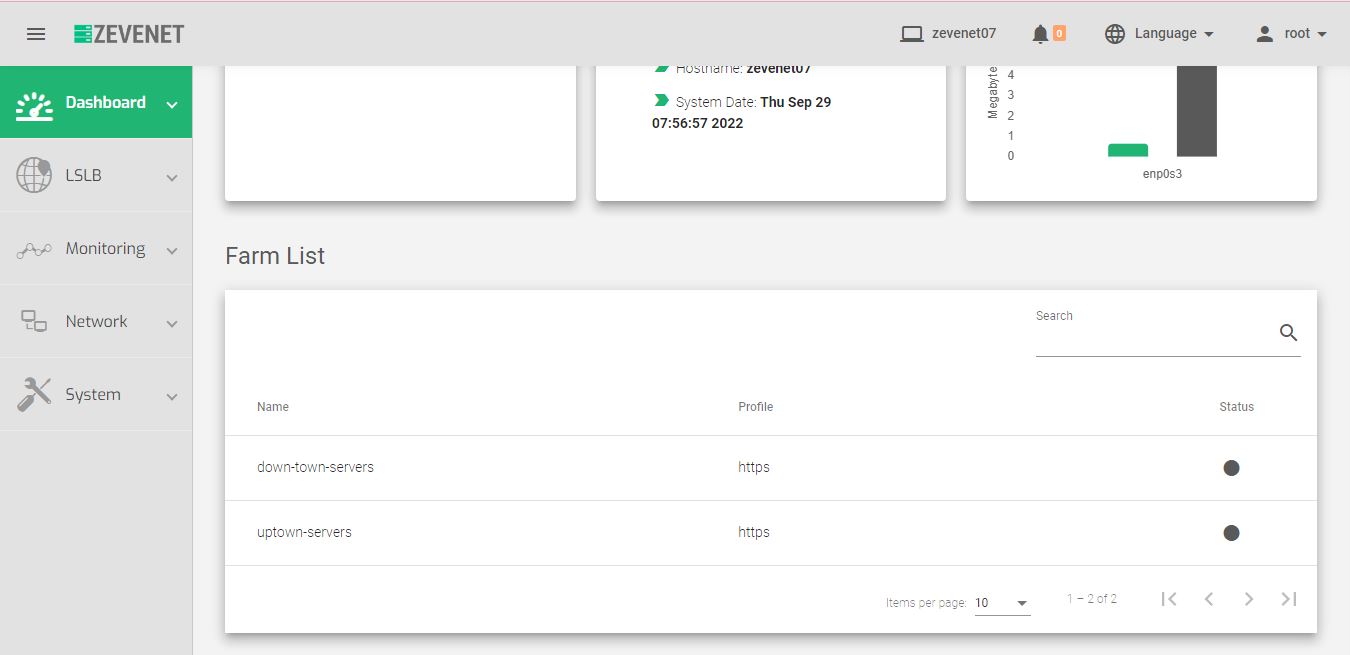
Here is a brief description of each table property
Name. A descriptive label that easily identifies a farm.
Profile. Farm protocol, whether it’s HTTP or HTTPS.
Status. Indicates the health status of each farm using color indicators.
Below is a brief description of each color indicator that shows the status of a farm.
- Green: Means UP. The farm is running and all servers are UP.
- Red: Means DOWN. The farm has stopped.
- Yellow: Means RESTART NEEDED. There are recent changes that need a farm restart to be applied.
- Black: Means CRITICAL. The farm is UP but there is no server available or they are in maintenance mode.
- Blue: Means PROBLEM. The farm is running but at least one server is down.
- Orange: Means MAINTENANCE. The farm is running but at least one server is in maintenance mode.
Next step, manage farms.
