Contents
SKUDONET offers a high volume of information through logs, this information can be stored and used to perform searches, such as attack patterns, malicious IP addresses, auditing of events in the system and a long range of utilities, but sometimes so much information makes it ungovernable and at the same time difficult to exploit, this is where SKUDONET integrates with data analysis solutions (big data) as important as Grafana, in the following document we will explain how to configure our SKUDONET load balancers to send the information to a remote server of Grafana configured with Loki and Promtail, the latter two allow Grafana to exploit logs from remote points.
Why a central console for Logs Management?
Many of our customers have a very high number of SKUDONET Appliances performing load balancing and protection operations thanks to our attack detection and prevention system. We have clients with more than 100 load balancers in production, as is the case of TI Companies. Cloud providers, or online banking, thanks to this configuration our clients can do quick searches in the logs and locate useful information.
How to configure the central console?
We will make a brief explanation of how to install the necessary Grafana stack (Grafana + Loki + Promtail) but this is not the main objective of this document, we will focus in more detail on how to configure Promtail, which will be in charge of receiving the logs and How to configure the SKUDONET Logs service to send information to the remote Promtail service.
Central Console installation.
We will proceed to deploy a Linux Server with Debian 12 Operating system, 4 GB RAM and 100 Gb SSD for storage, the hostname of this machine is grafana.skudonet.cloud, in this machine we will configure Grafana, Loki and Promtail, let start with Grafana Installation.
First, configure the Grafana repositories, we want to use them instead of using the default Debian packages:
Install required packages:
root@grafana.skudo.cloud# apt-get install -y apt-transport-https software-properties-common wget
Create the gpg file to confirm legitimated packages:
 root@grafana.skudo.cloud# mkdir -p /etc/apt/keyrings/
root@grafana.skudo.cloud# wget -q -O - https://apt.grafana.com/gpg.key | gpg --dearmor | sudo tee /etc/apt/keyrings/grafana.gpg > /dev/null
Configure APT pointing to Grafana Repository:
root@grafana.skudo.cloud# echo "deb [signed-by=/etc/apt/keyrings/grafana.gpg] https://apt.grafana.com stable main" | sudo tee -a /etc/apt/sources.list.d/grafana.list
root@grafana.skudo.cloud# apt-get update
root@grafana.skudo.cloud# apt-get install grafana
root@grafana.skudo.cloud# systemctl enable grafana-server
root@grafana.skudo.cloud# systemctl start grafana-serve
Now Grafana is accessible through port 3000, please open your browser and connect to the URL http://grafana.skudonet.cloud:3000
Default user admin and default password admin, the first time the login is done you have to modify the password.
Let continue now installing Loki,
root@grafana.skudo.cloud# apt-get install loki
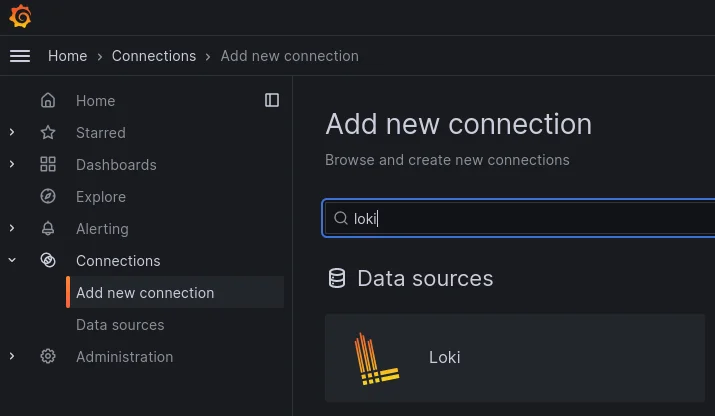
Now we have to indicate to Grafana that Loki will be used as a Data source, go to web GUI, section Connections, add a new connection and search Loki in the search form as shown below:
Now let’s configure the Loki connector, click on Loki and configure the Loki connector as shown:
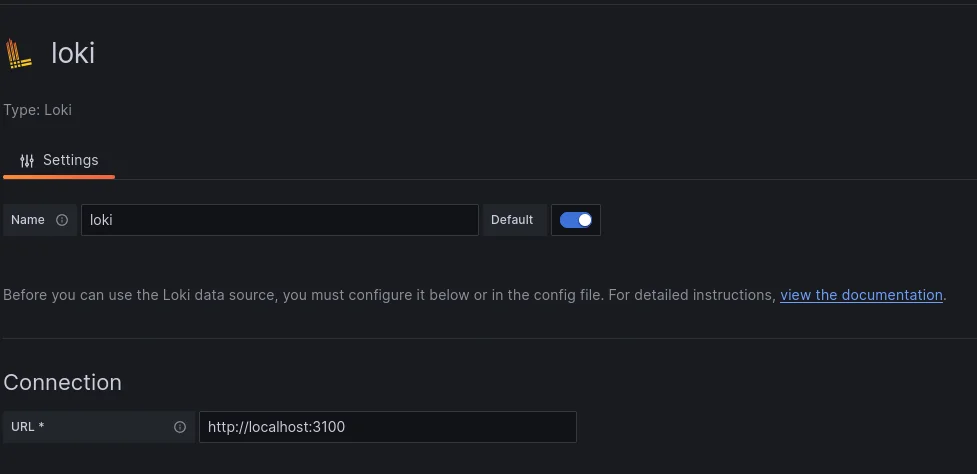
See referenced the URL parameter where Loki is listening by default.
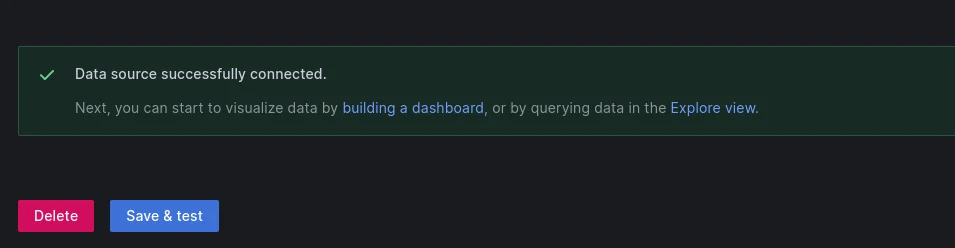
Click on the button save & test. If the configuration is correct you should see something like this:
Now let’s configure Promtail, go to the command line, install it and configure it as follows:
root@grafana.skudo.cloud# apt-get install promtail
root@grafana.skudo.cloud# vi /etc/promtail/config.yml
# This minimal config scrape only single log file.
# Primarily used in rpm/deb packaging where promtail service can be started during system init process.
# And too much scraping during init process can overload the complete system.
# https://github.com/grafana/loki/issues/11398

server:
  http_listen_port: 9080
  grpc_listen_port: 0

positions:
  filename: /tmp/positions.yaml

clients:
- url: http://localhost:3100/loki/api/v1/push

scrape_configs:
#- job_name: system
#  static_configs:
#  - targets:
#  	- localhost
#	labels:
#  	job: varlogs
#  	#NOTE: Need to be modified to scrape any additional logs of the system.
#  	__path__: /var/log/messages
- job_name: syslog
  syslog:
  	listen_address: 0.0.0.0:1514
  	labels:
    	   job: syslog
  relabel_configs:
    	- source_labels: [__syslog_message_hostname]
      	   target_label: host
    	- source_labels: [__syslog_message_hostname]
      	   target_label: hostname
    	- source_labels: [__syslog_message_severity]
      	   target_label: level
    	- source_labels: [__syslog_message_app_name]
      	   target_label: application
    	- source_labels: [__syslog_message_facility]
      	   target_label: facility
    	- source_labels: [__syslog_connection_hostname]
      	   target_label: connection_hostname
Restart promtail:
root@grafana.skudo.cloud# systemctl restart promtail
if the configuration is correct a new TCP port 1514 should be opened, this port is used by the remote SKUDONET Appliances to send the Logs.
Now enable the services by default after any server reboot
root@grafana.skudo.cloud# systemctl enable grafana
root@grafana.skudo.cloud# systemctl enable loki
root@grafana.skudo.cloud# systemctl enable promtail
Configure the SKUDONET Remote Servers with Grafana
Now connect to the SKUDONET Appliance where you want to configure sending logs to Grafana, in our example this server is called skd6k.skudonet.cloud, from the command line edit rsyslog server and add the following lines at the end of the file /etc/rsyslog.conf
 # Forward everything to grafana server.
*.*  action(type="omfwd"
   	protocol="tcp" target="grafana.skudonet.cloud" port="1514"
   	Template="RSYSLOG_SyslogProtocol23Format"
   	TCP_Framing="octet-counted" KeepAlive="on"
   	action.resumeRetryCount="-1"
   	queue.type="linkedlist" queue.size="50000")
Restart the rsyslog to apply the changes:
root@skd6k.skudo.cloud# /etc/init.d/rsyslog restart
Using Grafana Loki to check SKUDONET Logs
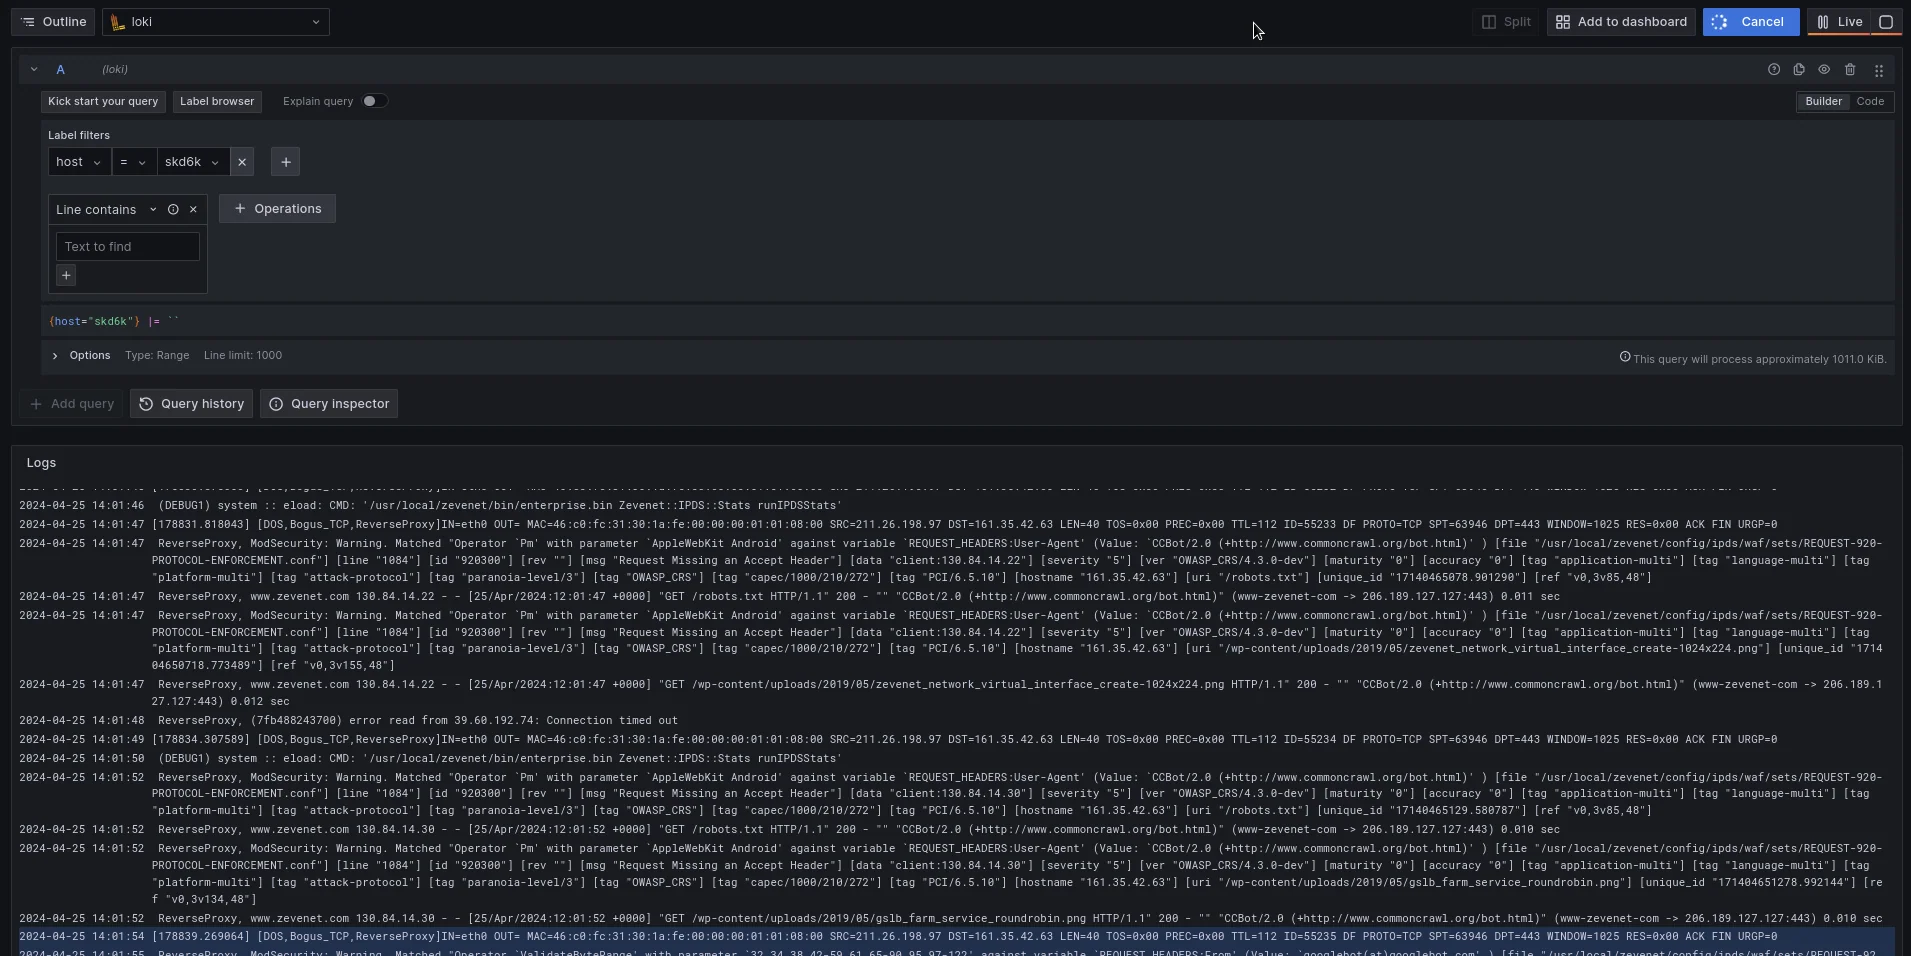
Now go to the Grafana web Console, Explore, search the Loki connector, and reference to Label filters, select here the field host and automatically the following field will be charged with the list of connected SKUDONET Appliances, in our example only one node will be listed with name skd6k:
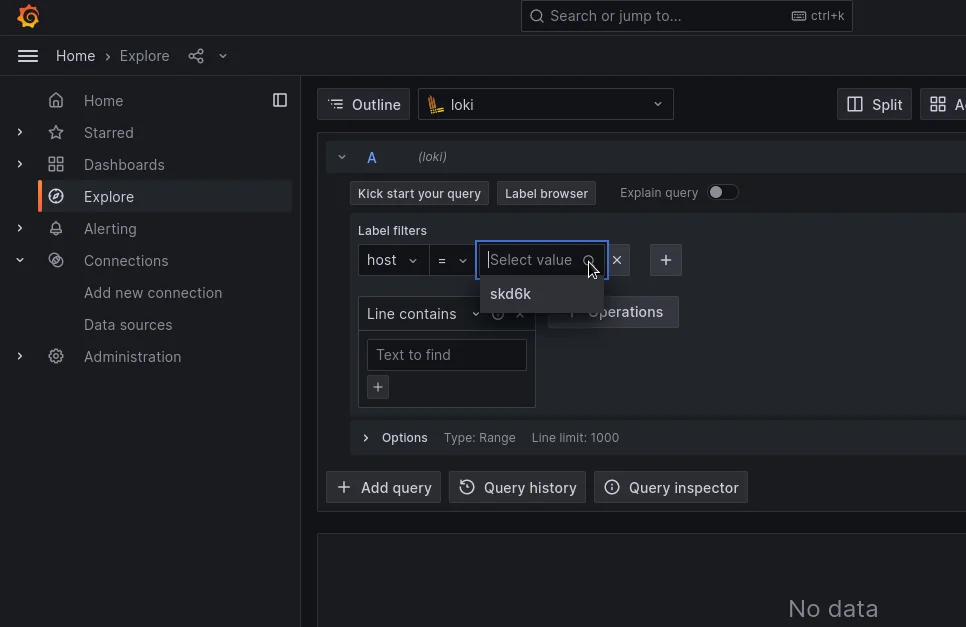
Click on the Live button and the console will start showing in real time the SKUDONET Logs.
The system lets you run a search based on different strings, please refer to the following strings for further information:
The line contains a farm name: You will see all the events for the indicated farm name, take into account that if logs are enabled for the indicated farm you will see all the traffic passing through the load balancer. In case IPDS is enabled for this farm you will see all the requests stopped as well.
The line contains the string WAF: All the WAF events will be shown.
Line contains a certain IP: The possibility to filter all the traffic and IPDS events related to certain IP.
In addition to searching for strings, you can configure a Dashboard and explore further with the Graphs and different methods that Loki offers to create dashboards.
If you want to read more about Logs please refer to the article:
