Contents
How SKUDONET WAF Audits HTTP and HTTPS Traffic
On the 8th of October 2023, the UK’s elections watchdog announced that it had been a victim of a “Complex cyber attack.” The hostile actors accessed registers containing over 40 million voters’ personal information.
And… The attack went undetected for about a year. Voters were not unaware of this for another ten months. Credit cards and driving license details of registered voters between 2014 and 2022. All in the hands of hackers.
Even the mightiest defenses are surprisingly vulnerable.
In 2023 alone, 75% of organizations faced an API-related breach, exposing sensitive data from customer orders to financial records. We predict that these numbers will soar in the upcoming years, and “that.. is.. expensive.”
We must proactively scan our infrastructure for vulnerabilities through extensive security audits.
Manual security audits, while necessary, are often expensive and time-consuming. This is where SKUDONET excels. SKUDONET automates comprehensive security audits for web applications and proactively identifies and patches vulnerabilities before they become exploitable.
WAAP Security in SKUDONET ADC
To ensure rock-solid web application security, the ADC includes a built-in Intrusion Detection and Prevention System (IPDS) module. This IPDS, a Web Application and API Protection (WAAP) module, detects malicious activity and safeguards IT infrastructure from hackers.
At its core is ModSecurity, an open-source Web Application Firewall that scans inbound HTTP or HTTPS traffic and neutralizes malicious attempts.
ModSecurity’s seamless integration with other WAFs, including AWS, Azure, Fortinet, and F5-Big IP, makes it a strong contender., as it leverages the OWASP CRS.
The Owasp Core ruleset
SKUDONET ADC utilizes a “vast library of industry-recognized rules”, and those rules come from OWASP CRS. These rules protect against SQL injections, Cross-site Scripting (XSS), Local file inclusion, Remote file inclusion, etc.
This is just a sampling of the many attack vectors that SKUDONET monitors. To learn more about enhancing Web security using the SKUDONET WAF, Read: Enhancing Web Security with WAF
Auditing in SKUDONET WAF
When an HTTP Farm receives an inbound request, the request data is encrypted. So, we can not examine it for any potential threats. The load balancer must decrypt the request before forwarding it to the WAF.
The SKUDONET WAF then carefully examines all the decrypted packets to spot and stop any malicious payloads. SKUDONET inspects every part of request and response data, including the server ID generating a response, client IP, time stamps, and other relevant details.
If the Farm has more than one WAF ruleset, then the ruleset for logging Audits must be given the highest priority so that we can log the contents of the requests before inspecting for malicious payloads. This helps you quickly investigate any potential threats.
The ADC saves Audit logs in the file: /var/log/waf_audit.log in a JSON format. We’ll discuss more about this log file after creating the WAF ruleset.
Enabling Security Audits in the SKUDONET WAF
To Enable Security Audits in the SKUDONET WAF, one must:
- Create an IPDS WAF ruleset.
- Add rules to the ruleset.
- Enable the ruleset.
- Apply the IPDS WAF ruleset to a given Farm.
- If the farm has more than one WAF ruleset, reorder them such that the Audit ruleset is on top.
- Allow traffic to flow through the farm that is using this rule
Creating a WAF ruleset.
-
- Go to the IPDS > WAF > Rulesets section.
- Add a new ruleset by clicking the Create WAF ruleset button.
- Enter the name SKUDONET_REQUEST_RESPONSE_HEADERS_AUDIT
- Click the Apply button. Congrats! You just created a WAF ruleset.
- In the Global tab of the configurations page, toggle on the Audit button.
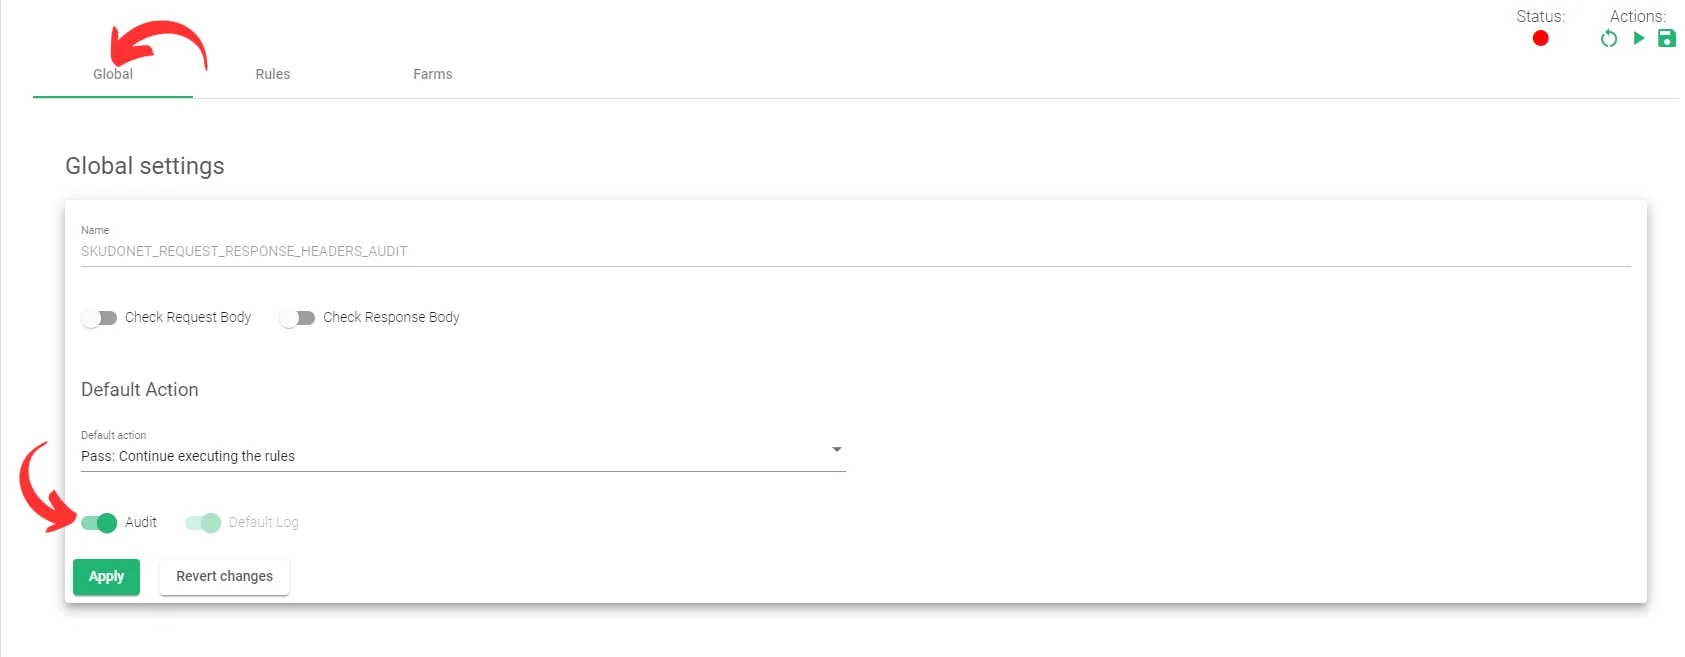
- Click Apply to save the changes. With the Audit button toggled on, Audit logs will be saved in the file. /var/log/waf_audit.log
Adding Rules to the ruleset
A ruleset cannot be without rules, so we must add them. Follow the instructions below:
-
- Click on the Rules tab, and create two new Custom rules.
- For the first rule, select the Rule type as Custom and add the command below in the Rule field:
SecRule REQUEST_METHOD  "@unconditionalMatch"  "\
        id:1,\
        msg:'SKUDONET Request headers',\
        phase:1,\
        pass,\
        auditlog" #
-
- Click the Appy button.
- For the second rule, select the Rule type as Custom and add the command below in the Rule field:
SecRule RESPONSE_HEADERS:Server "@unconditionalMatch " "\
        id:2,\
        msg:'SKUDONET Response headers',\
        phase:3,\
        pass,\
        auditlog" #
- Click the Apply button. Congrats! This is a ruleset with rules.
The first rule inspects the request headers and the second rule inspects the response headers. Remember that the information generated from the two rules will be saved in the file: /var/log/waf_audit.log, the logs for auditing are saved in /var/log/waf_audit.log and not integrated into the log rotation system, so the system administration needs to delete it once the troubleshooting action is concluded.
But, how do we inspect the traffic without adding this rule on a given Farm? One is required to have an Active HTTP farm to apply this rule.
Adding the Rule to an HTTP farm.
If you haven’t created an HTTP Farm to let the traffic flow through, refer to this article. Layer 4 and Layer 7 Virtual Server Configuration. If you already have, follow the instructions below:
-
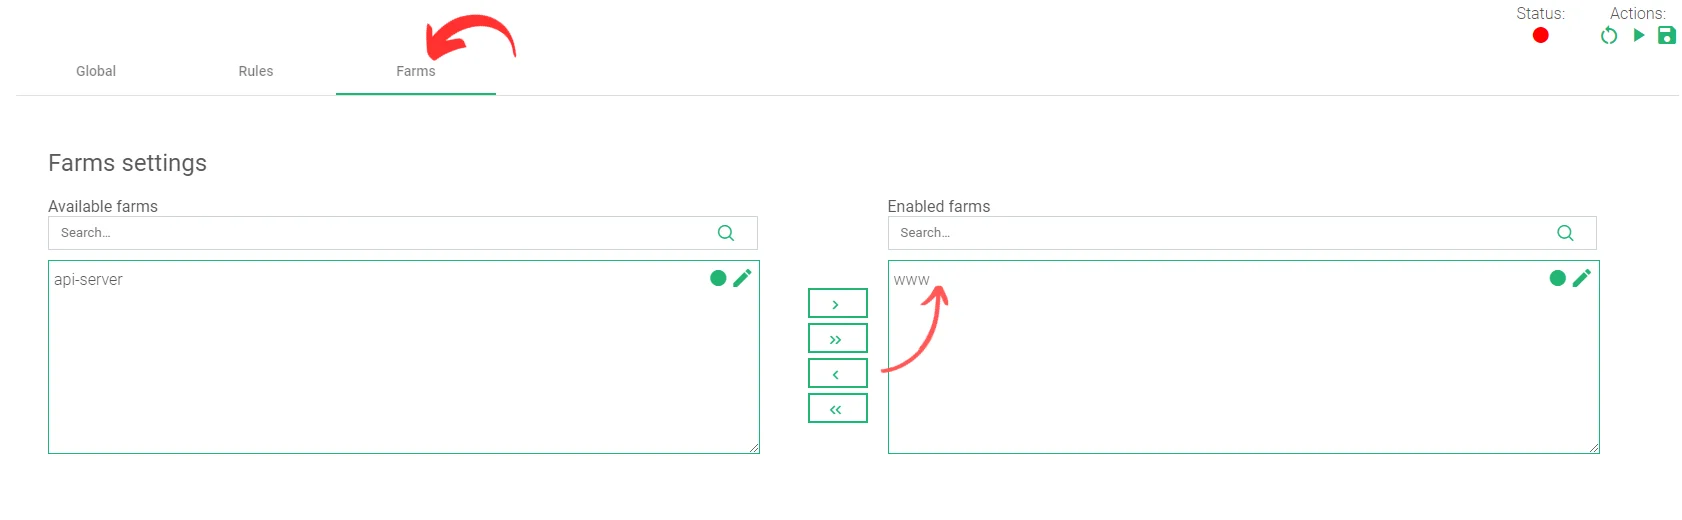
- Click the Farms tab on the Settings page of your Ruleset.
- In the Available Farms table, drag and drop the farm you want the traffic to flow through to the Enabled Farms table.
-
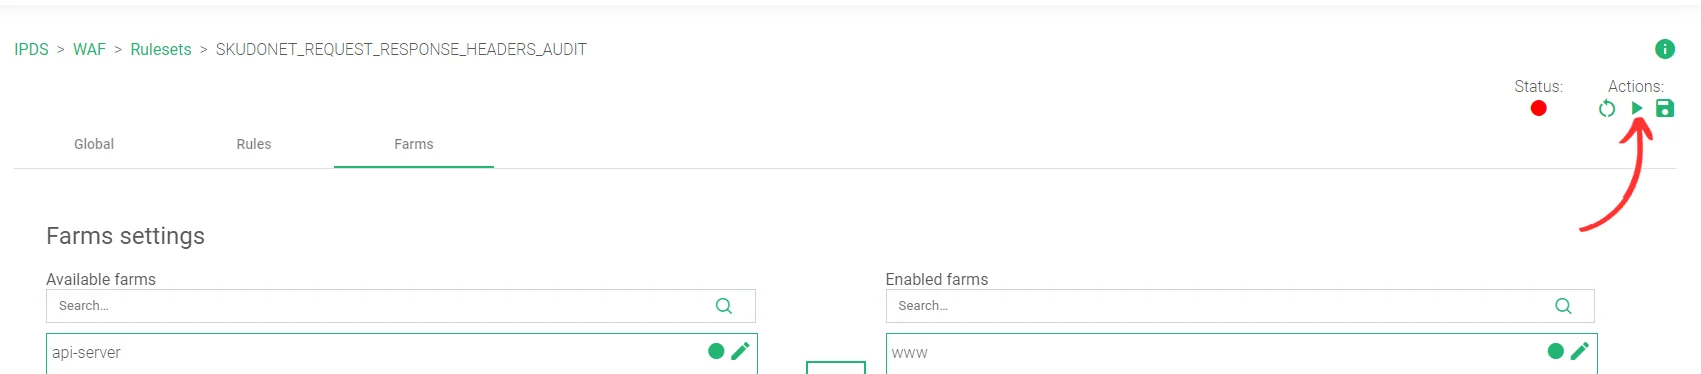
- Within the Actions section for the ruleset, click the Green Play button to Activate this ruleset.
Testing
After creating the Ruleset, we must generate HTTP traffic through the Farm.
Generate traffic to this farm using any HTTP client like your browser, a command line interface, or third-party clients like Thunder client to the Virtual IP (VIP) address and Port of your Farm.
To view the Audit saved inside the file /var/log/waf_audit.log: Execute the command:
tail -f /var/log/waf_audit.log
Huh… That is unreadable! Let’s prettify it.
First, you’ll need to create an executable file named json_pretty by running the command below:
nano /usr/local/zevenet/bin/json_pretty
Copy and paste this Python script to the file and Save it.
#!/usr/bin/env python

import sys
import json


def print_json(l):
    try:
        j = json.loads(l)
        print json.dumps(j, indent=4, sort_keys=True)
        print
        print "-" * 50
    except:
        pass

try:
    buff = ''
    while True:
        buff += sys.stdin.read(1)
        if buff.endswith('n'):
            print_json(buff[:-1])
            buff = ''
except KeyboardInterrupt:
   sys.stdout.flush()
   pass
This file does not have the executable file permissions yet. To enable the permissions, run the command:
chmod +x /usr/local/zevenet/bin/json_pretty
To view that prettified waf_audit.log, run the command:
tail -f /var/log/waf_audit.log | json_pretty
This command lets you view the latest request entries. Whenever you receive a request to the load balancer, each request transaction is appended to the bottom of the log file.
This is what the prettified waf_audit.log file looks like.
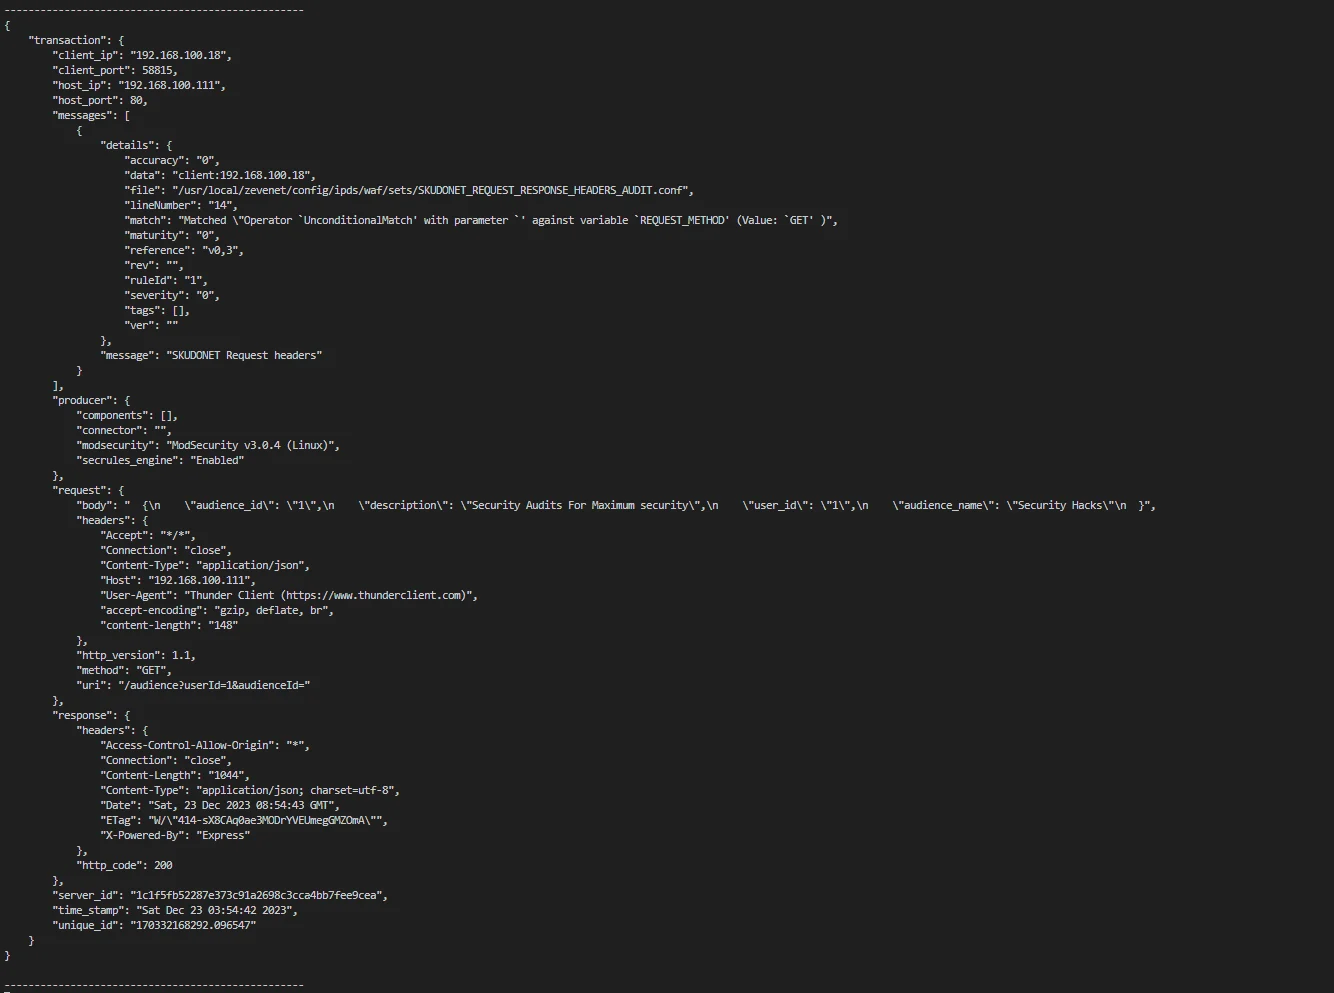
Refer to two important sections in the JSON log for HTTP, the request and the response section. The request section contains Headers, body, and URI parameters sent by the client. We must monitor all requests and their contents before forwarding them to the server. If any malicious payloads exist, we must filter them out to protect IT infrastructure from any security breaches.
The response section contains server-specific details. These include the status codes, server, content type, content length, body, etc. We need all these for further analysis. Each logged response corresponds to the initiating client request.
Conclusion
Security audits can be made easier by analyzing the transaction logs generated by SKUDONET. This allows IT teams to troubleshoot, quickly identify any suspicious activity, and take corrective action.
By tracking access to sensitive data, organizations can demonstrate accountability and build trust with their customers.
A quick question though. How do you proactively safeguard your IT infrastructure? We’re always curious!
You may wanna take a look at Skudonet’s 2023 Resume.
