Contents
SKUDONET Community Edition 7.0 Dashboard
The Skudonet dashboard provides an up-to-date overview of the entire load balancer, including CPU and memory usage, load, system information, farm status, and more.
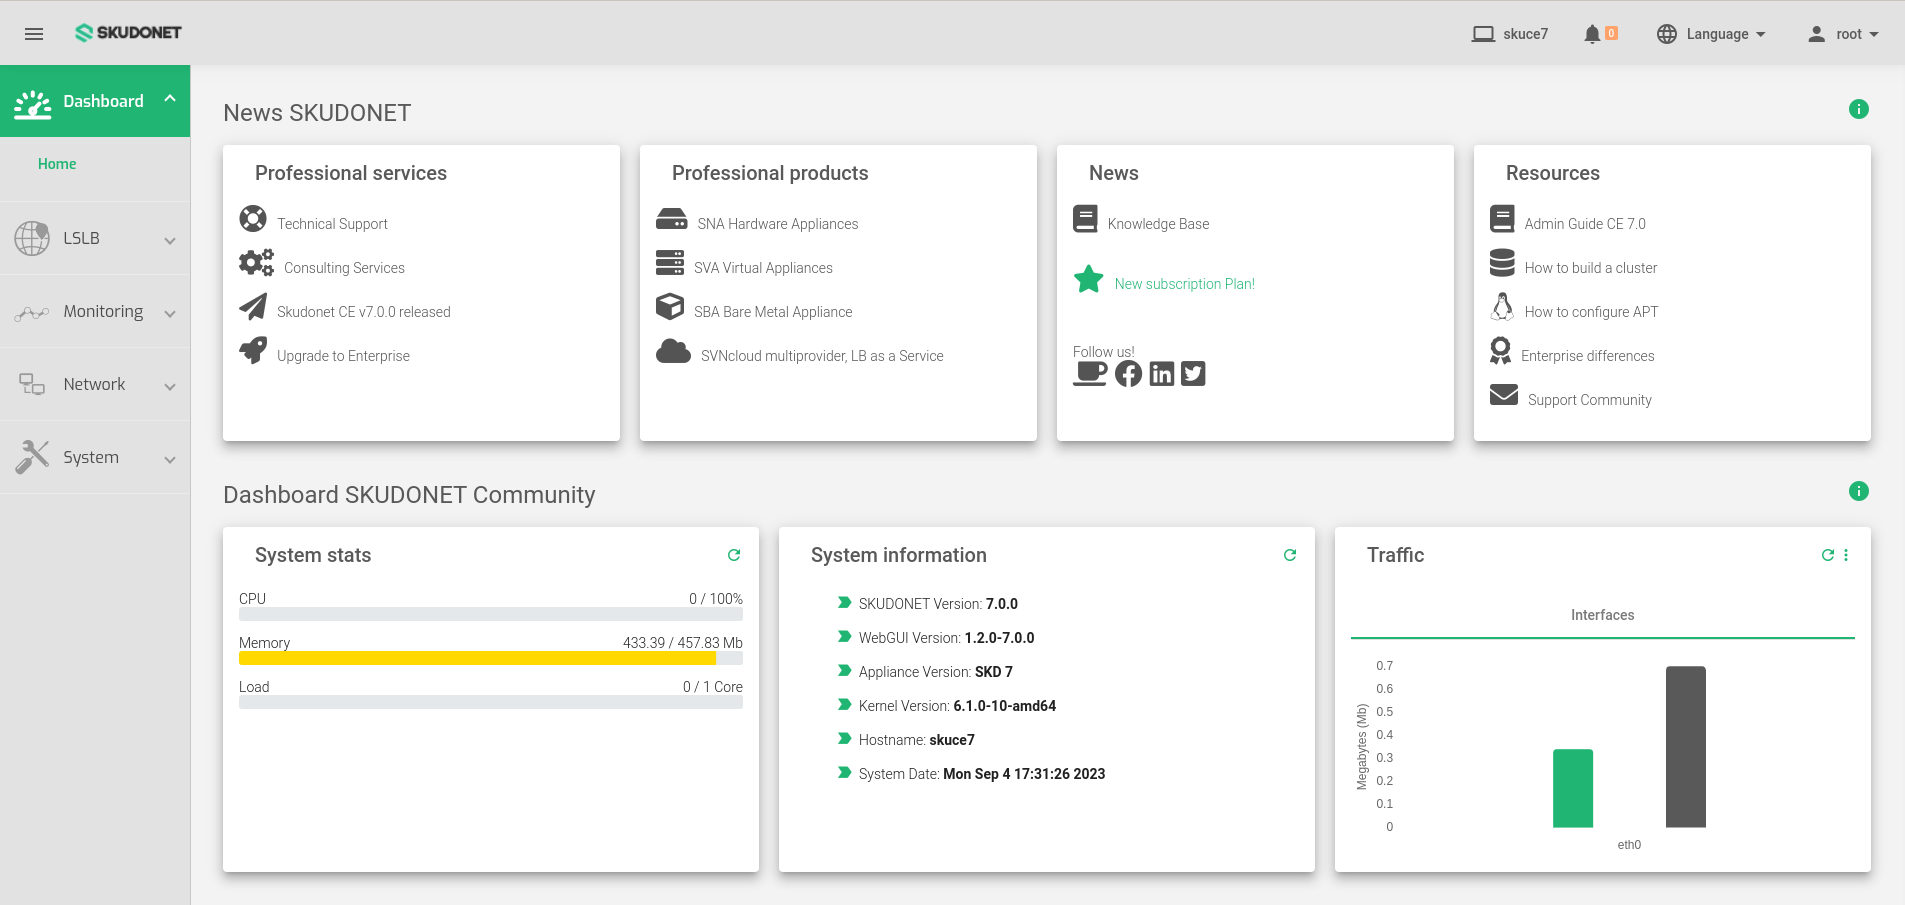
The dashboard is divided into five main sections:
- News SKUDONET: This section provides news about various services provided by SKUDONET. This also includes professional products, professional services, News, and Resources
- System Stats: This section displays real-time system statistics, such as CPU and memory usage, and load.
- System Information: This section provides general information about the load balancer, such as the version numbers, System date, hostname, etc.
- Farm Lists: This section lists all of the farms configured on the load balancer, along with their status and other information.
- Traffic: This section lists all of the network interfaces on the load balancer and their current status.
News SKUDONET
The top section of the dashboard provides information about SKUDONET’s professional services, products, news, and resources. This includes links to various SKUDONET products, as well as the latest news and educational information about SKUDONET Community Edition.
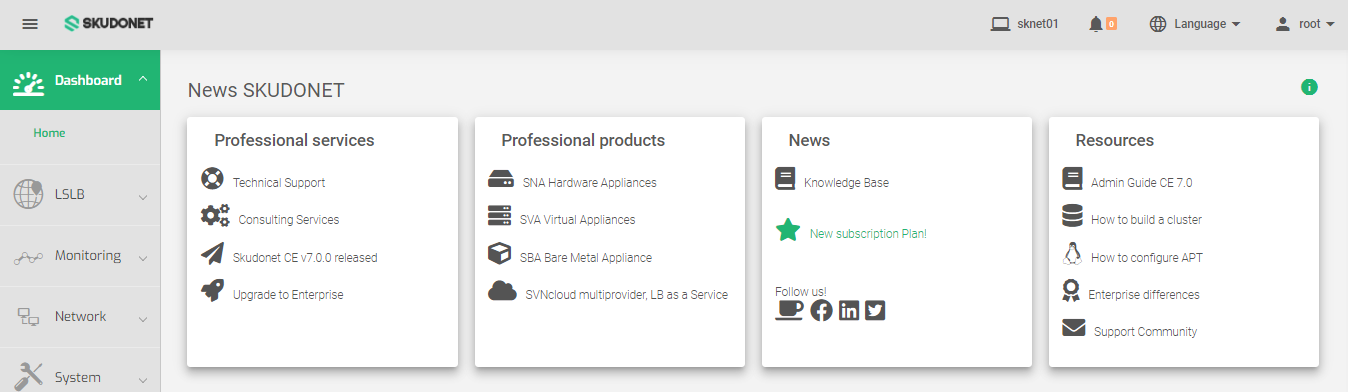
In other words, the News SKUDONET section provides a way for users to learn more about Skudonet and its offerings. It can be a good place to start for users who are new to SKUDONET or who are looking for more information about specific products or services.
System Stats
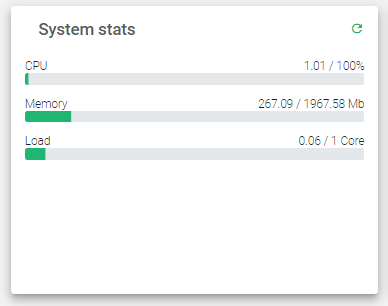
- CPU Usage: This shows the percentage of CPU resources that are currently being used by the load balancer.
- Memory Usage: This shows the percentage of memory resources that are currently being used by the load balancer.
- Load Usage: This shows the number of CPU cores that are currently being used by the load balancer, as well as the historical load over the past 1, 5, and 15 minutes.
System Information
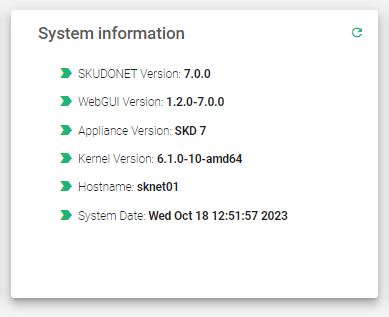
Provides basic information about the load balancer, such as the Skudonet version, appliance version and hypervisor, kernel version, hostname, and system date.
Traffic
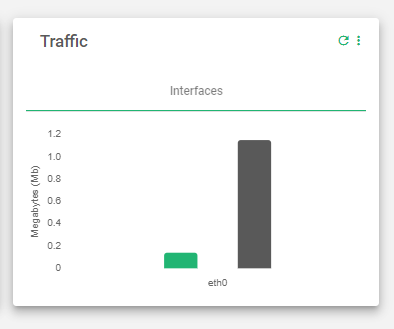
Shows the network interfaces or adapters that are configured on the load balancer, as well as the current inbound and outbound traffic on each interface.
- Green: Inbound Traffic
- Grey: Outbound Traffic
Farm List
The Farm List section provides a list of all farms that are configured on the Skudonet appliance. In Skudonet Community Edition 7.0, only the LSLB farm module is available.
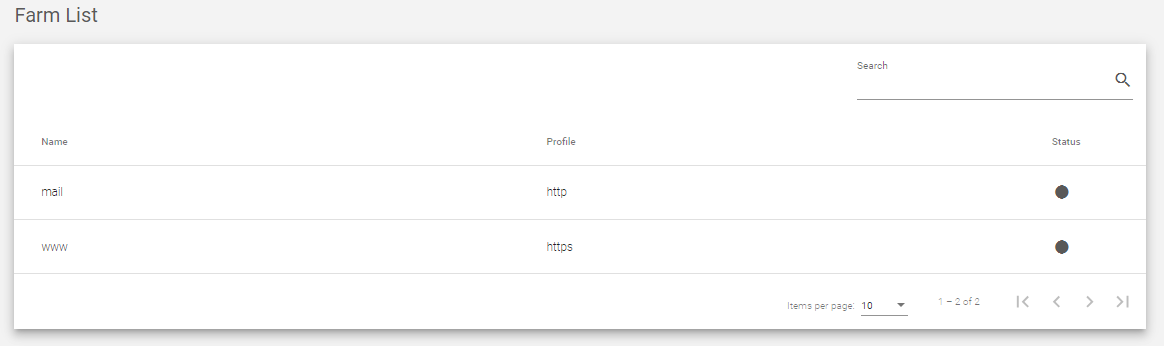
Name: A unique identifier for the farm.
Profile: The protocol that the farm uses, such as HTTP or HTTPS.
Status: The current health status of the farm, indicated by a color indicator. Here is a brief description of the different colors that are used to indicate the health of a farm.
- Green: Running normally.
- Red: Not running.
- Yellow: Needs restart for recent changes to take effect.
- Black: Running, but no available servers or servers in maintenance mode.
- Blue: Running, but at least one server down.
- Orange: Running, but at least one server in maintenance mode.
Next Article: LSLB Farms
