The Monitoring > Stats section is divided into two main sections:
- Farm Stats
- Network Stats
Farm Stats
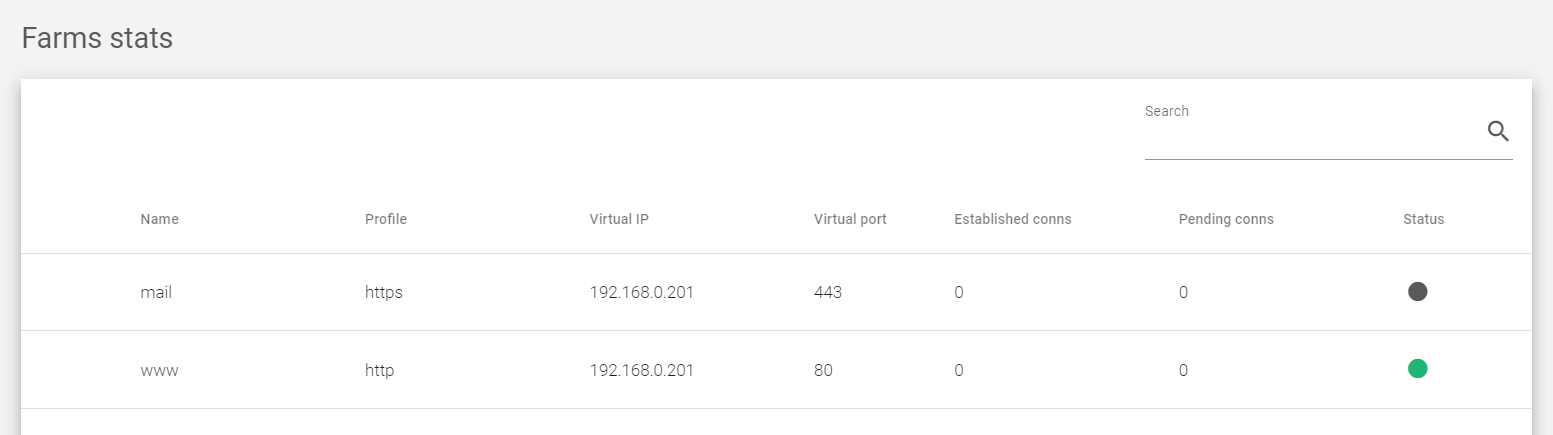
This section provides a detailed overview of the statistics for farms and load balancing services. It includes a table that shows the number of the most recent Established and Pending connections for each LSLB farm.

The table shows the following information about each LSLB farm:
Name: A unique identifier for the farm.
Profile: The type of farm profile, either HTTP or L4xNAT.
Virtual IP: The virtual IP address that receives traffic for the farm.
Virtual Port: The port that the load balancer uses to manage and distribute traffic to the farm.
Established Conns: The number of active connections to the farm. This does not necessarily mean one connection per connected client.
Pending Conns: The number of connections that are waiting to be served by the farm.
Status: The availability status of the farm, indicated by the following colors:
- Green: The farm is running and all backends are UP.
- Red: The farm has stopped.
- Yellow: There are recent changes that need to be applied by restarting the farm.
- Black: The farm is UP, but there are no backends available or they are in maintenance mode.
- Blue: The farm is running, but at least one backend is down.
- Orange: The farm is running, but at least one backend is in maintenance mode.
Actions: This column allows you to view more detailed statistics for the farm.

- Show Backends: This displays all backend servers configured on a particular farm, and the number of client connected to that particular farm.
- Show Graphs: Shows the graphs for the chosen farm.
Show Backends: Stats for monitoring Backends
The following labels describe each column within the backend stats section.
Name: A unique identifier for the farm.
Profile: Determines if the farm is an HTTP, HTTPS or an L4xNAT farm.
Virtual IP: The IP address of the real server.
Virtual Port: The port(s) that the real server is listening on.
Established conns: The number of active connections to the real server (only for LSLB farms).
Pending conns: The number of connections that are waiting to be served by the real server (only for LSLB farms).
Status: The health status of the real server, indicated by the following colors:
- Green: The real server is running normally.
- Orange: The real server is in maintenance mode.
- Red: The real server is unreachable.
Backends
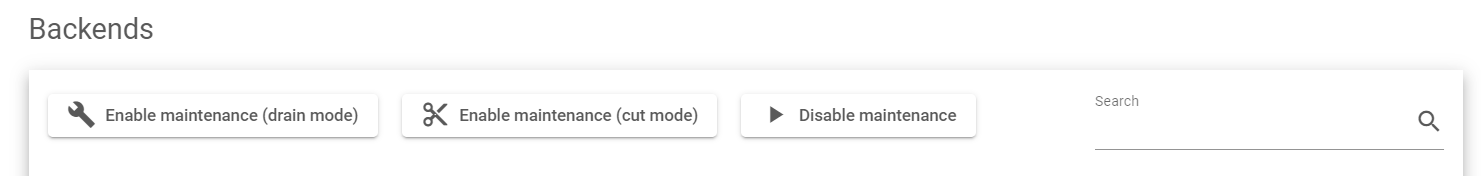
Actions: Use the following actions to manage the status of a backend server.
- Enable maintenance: Places the backend in maintenance mode. The two modes include
- Drain mode: Stops new connections from reaching the backend, but allows existing connections to continue uninterrupted.
- Cut mode: Closes all current connections and places the backend in maintenance mode immediately.
- Disable maintenance: Makes the backend available for new connections.
Sessions
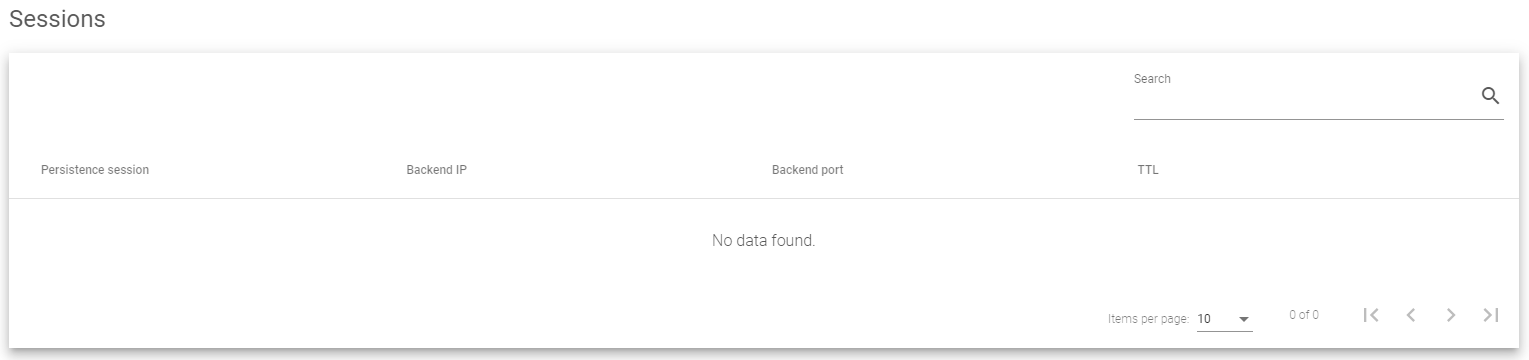
The Farm Sessions table shows the following information for each session:
- Persistence session: The type of Session used by the farm. This could be IP-based, Cookie-based or URL-based sessions.
- Backend IP: The IP address of the backend server processing the requests
- Backend Port: The port of the backend server on which it is receiving the traffic
- TTL: Controls how long a session ID is valid.
Network Stats
The network interface traffic statistics section provides information about the inbound and outbound traffic passing through the network interfaces on the load balancer.
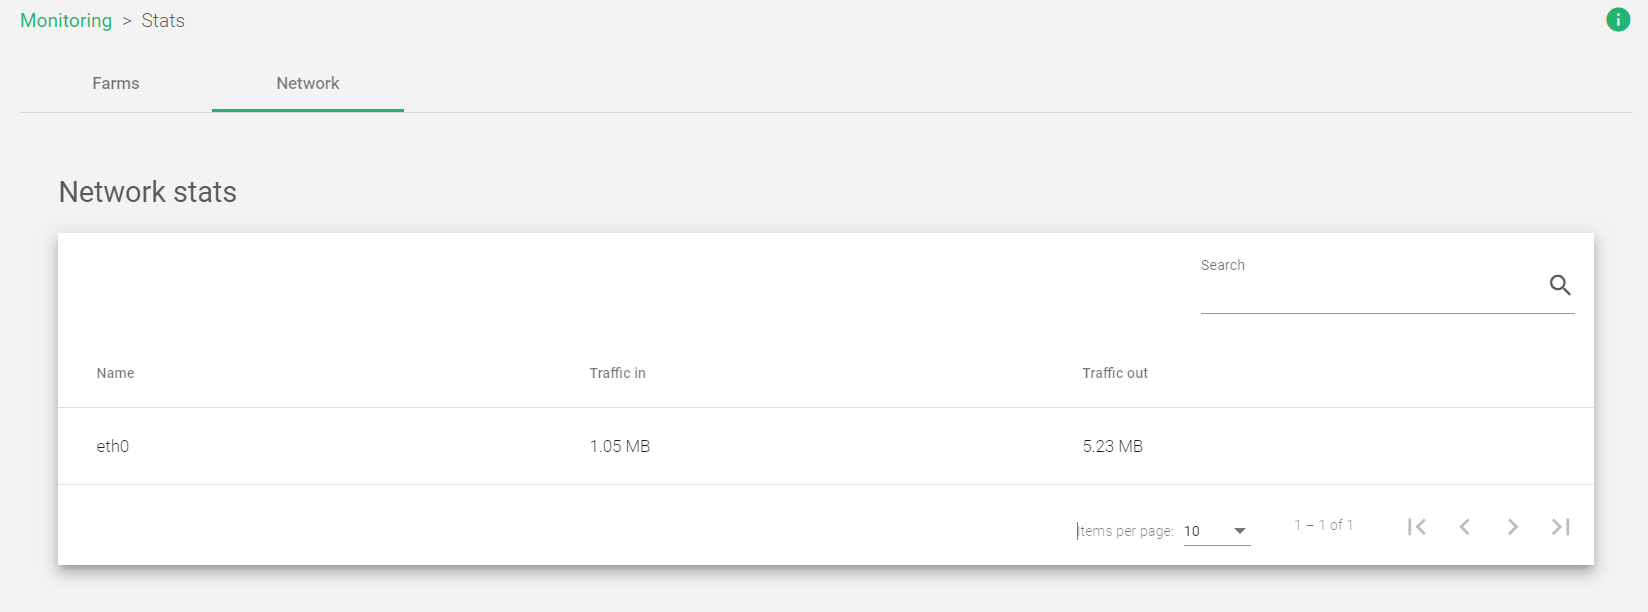
The following are the properties about each interface as shown in the image above
Name: The name of the network interface. This can be the name of a NIC, VLAN, or bonding interface.
Traffic in: The number of requests received by the network interface.
Traffic out: The number of responses sent by the network interface.
More about Traffic Stats
Traffic in: This includes all packets received by the network interface, regardless of whether they are destined for the load balancer itself or for another device on the network.
Traffic out: This includes all packets sent by the network interface, regardless of whether they are originated by the load balancer itself or by another device on the network.
The network interface traffic statistics can be used to monitor the performance of the load balancer and to identify any potential network problems. For example, if you see a sudden increase in traffic in or out of a particular network interface, this may indicate a problem with the load balancer itself or with the network connection to that interface.
Next Article: Monitoring | Farmguardians
