Contents
Dashboard | SKUDONET Enterprise 6.3
The dashboard provides an overview of the load balancer’s current status, including the CPU, Memory, Load, Connections, System information, Farms, and more.
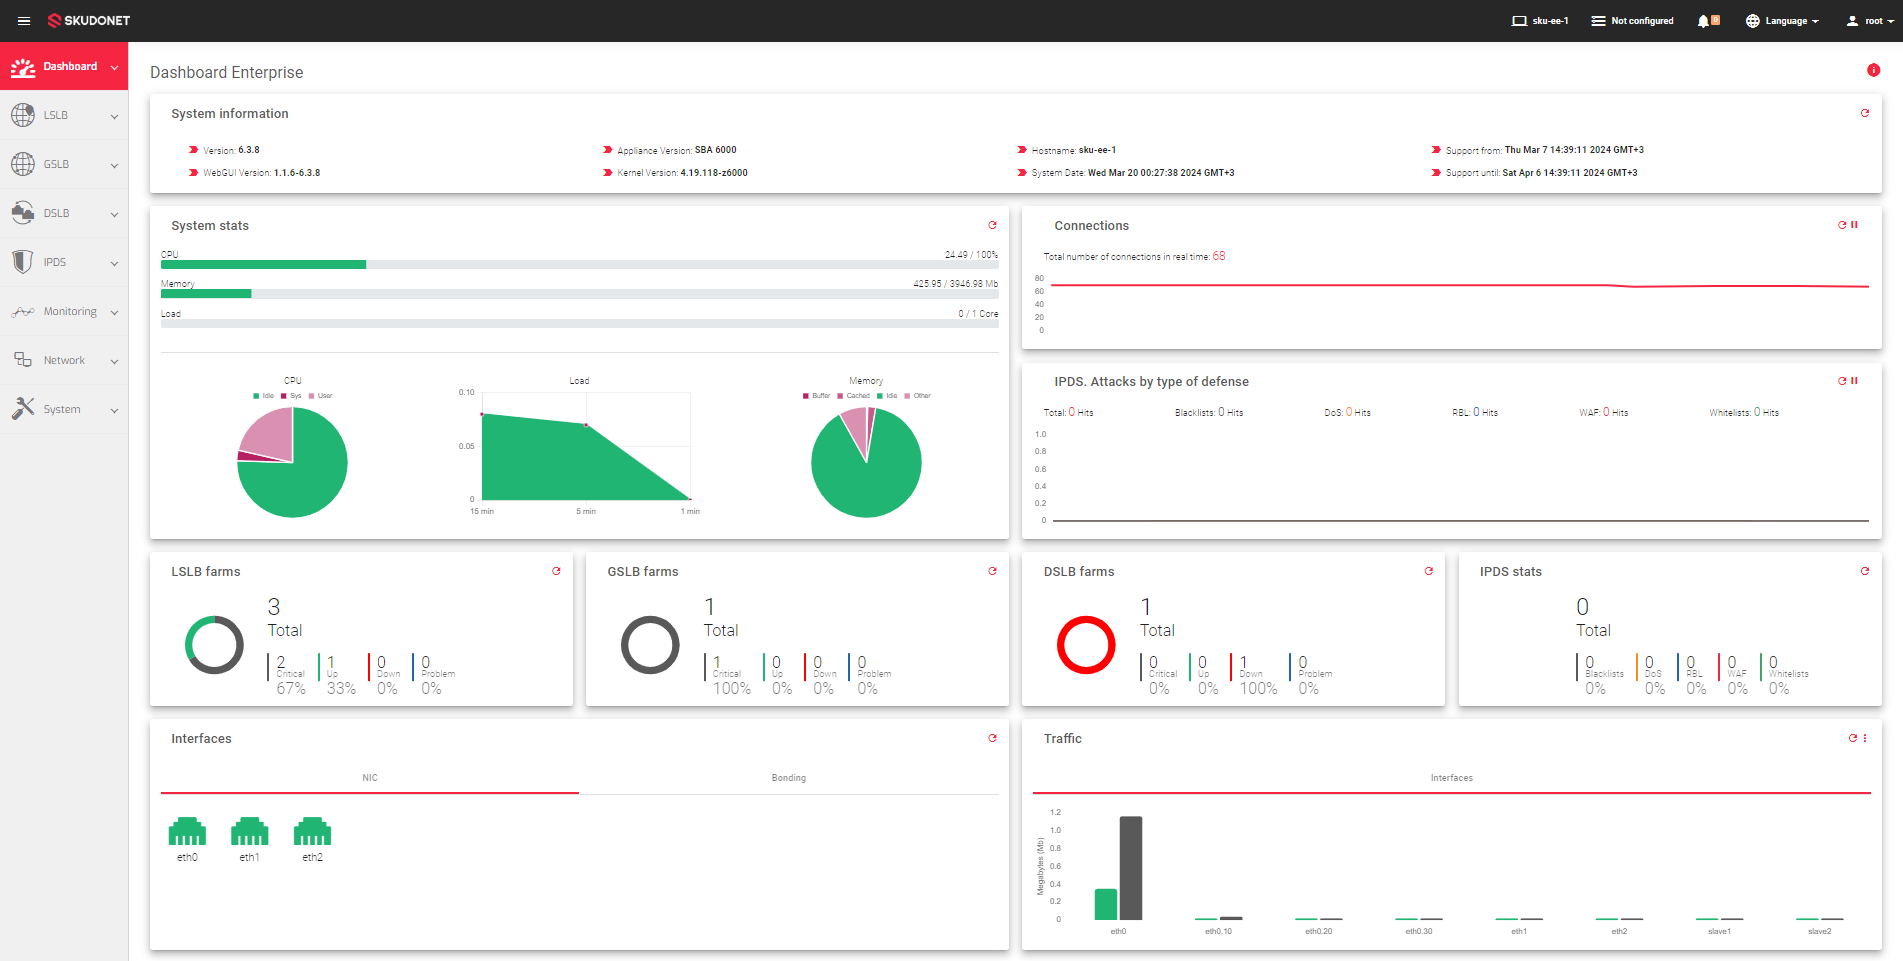
The Dasbhoard page is divided into six main sub-sections:
- System Stats
- Connections
- System Information
- Farms
- LSLB
- GSLB
- DSLB
- Interfaces
- Traffic
System Stats
The System stats sections shows how much CPU, Memory, and Load are being used by the SKUDONET Appliance.
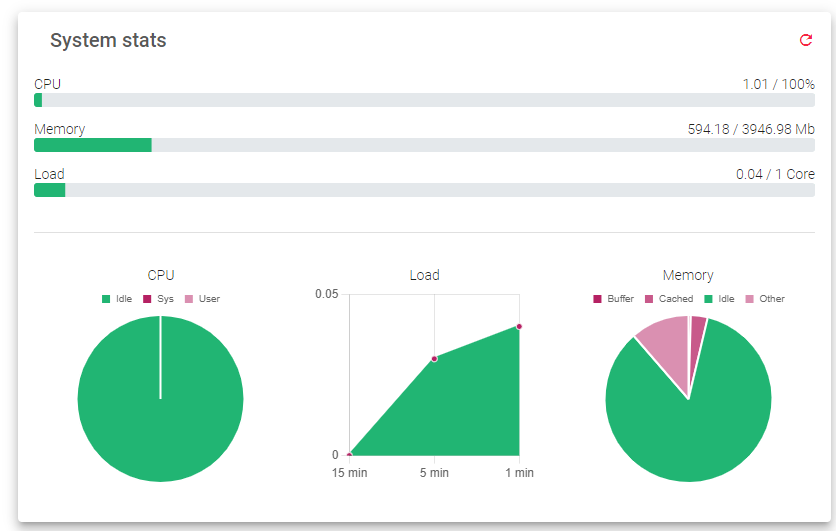
At the top right corner, there is a Red refresh button. Once clicked, the data on each graph will update.
CPU
These are the CPU availability metrics, which are represented in percentages on the graphs:
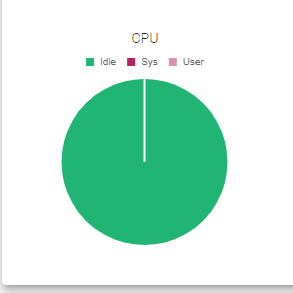
- Idle: The percentage of CPU resources that are not in use.
- Sys: The percentage of CPU resources that are being used by kernel processes, such as L4 farms and network drivers.
- User: The percentage of CPU resources that are being used by user-space processes, such as HTTP/S load balance cores and the administration web server.
Load Usage
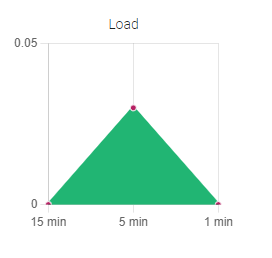
This section shows the number of loads on each core of the processor, and how the load has been utilized over the past 1, 5, and 15 minutes.
Memory Usage
The memory usage section on the dashboard provides a snapshot of how the system’s memory is being used. It shows the amount of memory that is being used by buffers, cached data, idle memory, and other system processes.
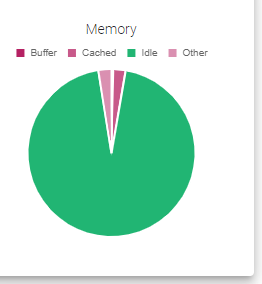
- Buffers: Memory used to bridge the speed gap between the processor and storage.
- Cached: Fast memory on the processor that stores frequently accessed data.
- Idle: Memory available for the system to use for new or existing processes.
- Others: Memory used by the kernel and other system processes.
Connections Graph
The connection graph shows how all of the different parts of the application are connected to each other. It is updated every 5 seconds, so you can see how the connections are changing in real-time.
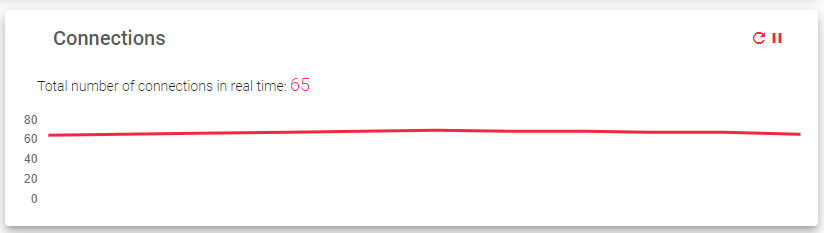
One can also manually refresh the graph by clicking the Red refresh button in the top right corner.
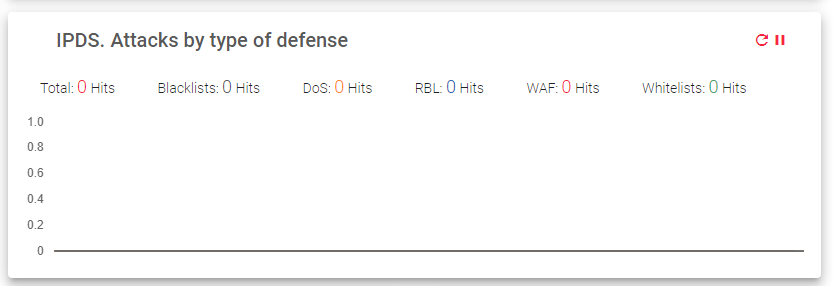
IPDS. Attacks by type of defense
This graph shows the total IPDS attacks detected across all defense types on farms within the ADC. See IPDS | Stats for details.
System Information
This section shows basic information related to the appliance. This includes:
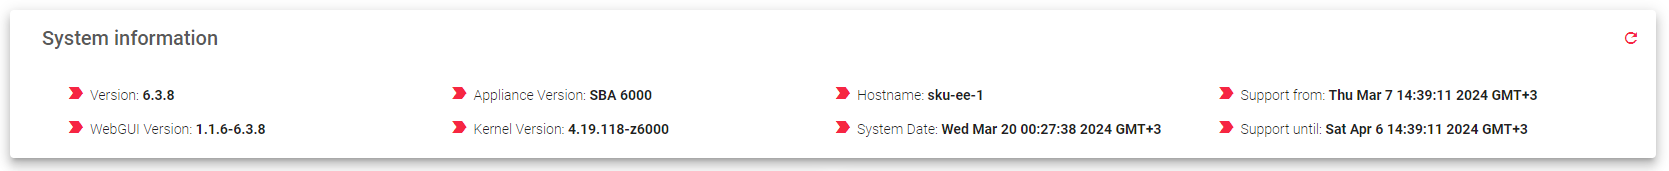
- Version: Software version of the SKUDONET ADC (Application Delivery Controller).
- WebGUI Version: Version of the web interface used to manage the SKUDONET ADC.
- Appliance Version: Hardware model of the SKUDONET ADC appliance.
- Kernel Version: Version of the operating system kernel running on the SKUDONET ADC.
- Hostname: Unique identifier assigned to this specific SKUDONET ADC.
- System Date: Current date and time on the SKUDONET ADC (in GMT+3 time zone).
- Support from: Start date of the support contract for this SKUDONET ADC (in GMT+3 time zone).
- Support until: End date of the support contract for this SKUDONET ADC (in GMT+3 time zone).
Farms Information
The farm section shows an overview of the SKUDONET load balancer cores. SKUDONET can load balance at different layers of the network stack and implements key load balancing methods.
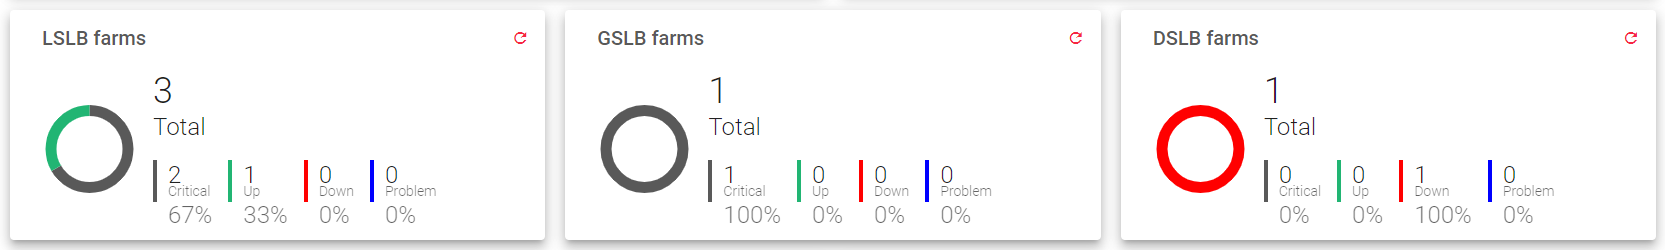
Available farms:
- LSLB: This farm load balances virtual services and applications at Layer 4 (Transport layer) through the L4xNAT profile and at Layer 7 (Application layer) through the HTTP profile. It supports a variety of protocols, including TCP, UDP, SIP, FTP, TFTP, SCTP, AMANDA, H323, IRC, NETBIOS-NS, PPTP, SANE, SNMP, HTTP, and HTTPS. More info
- DSLB: This farm load balances Layer 3 (network layer) traffic using dynamic load balancing routing, also known as SD-WAN. More info
- GSLB: This farm load balances domains and data centers using DNS to correctly distribute traffic to the right data centers. More info
Important Notice!
Each farm profile shows the total number of servers in the farm and their status. The status can be one of the following:
- Critical: The farm is up, but none of the backend servers are reachable. This could be because the servers are down, or because they are in maintenance mode.
- Up: The farm is running normally.
- Down: The farm is completely stopped.
- Problem: The farm is up, but at least one of the backend servers is not reachable or is having a problem.
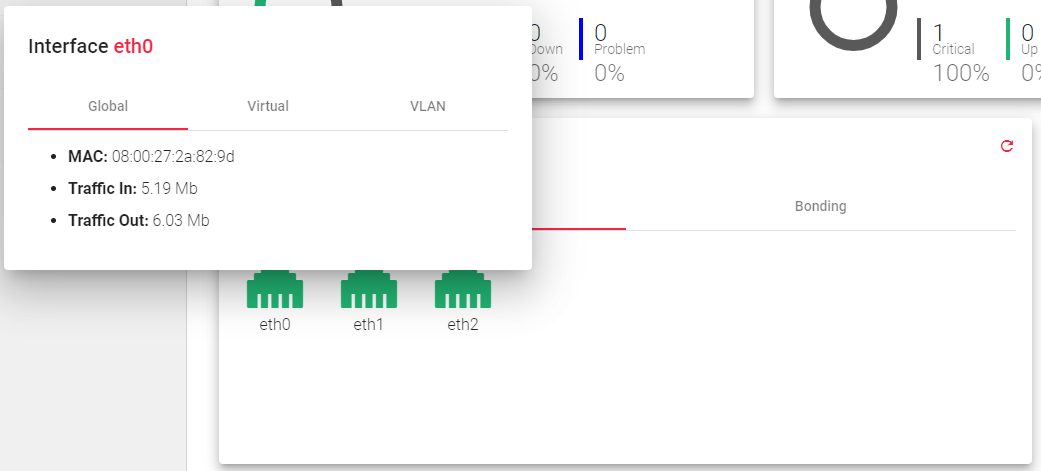
NIC Interfaces
The NIC subsection shows the network interfaces that the servers in the farm are using.
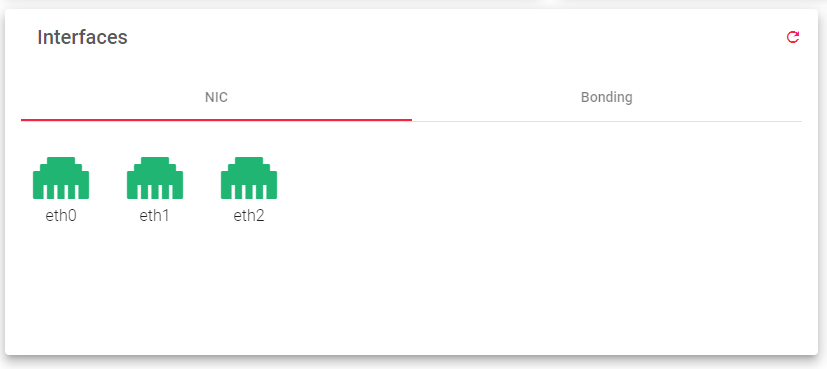
Hover over a network interface to see more information about Global, Virtual and Vlan interfaces.
Traffic
The Traffic section provides information about both inbound and outbound traffic for each interface on the SKUDONET ADC. This information can be used to monitor network performance, identify potential security threats, and troubleshoot network problems: We traffic both inbound and outbound traffic.
- Inbound traffic: The amount of data received by the SKUDONET ADC from external sources, such as clients or other servers.
- Outbound traffic: The amount of data sent by the SKUDONET ADC to external sources.
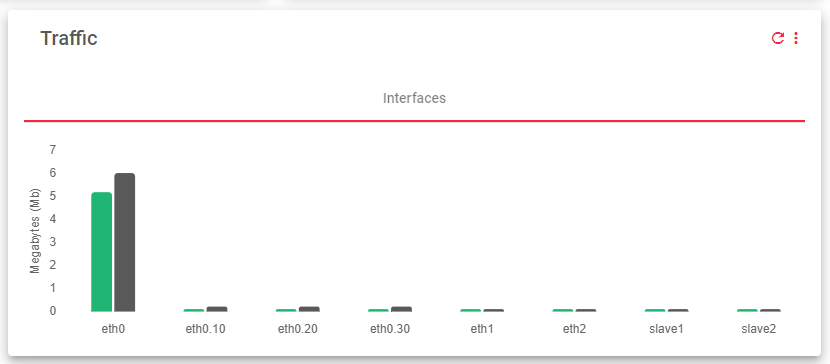
Representations
- Green: Inbound Traffic
- Gray: Outbound Traffic
Next Article: Dashboard | News
