Contents
The monitoring section connects all of the systems, network interfaces, farm services, and monitoring graphs. These graphs are essential for getting detailed reports and monitoring information about the resources that a load balancer is using for each task. They can also help you easily detect any resource limitations or bottlenecks in your load balancer and services.
Each monitoring section includes daily, weekly, monthly, and yearly graphs.
Each graph has the following fields:
- Last: This shows the most recent value recorded within a specific period.
- Min: This displays the lowest value recorded among the statistical graphs within a selected period.
- Avg: This shows the average value calculated from the statistical graphs within a selected period.
- Max: This displays the highest value recorded among the statistical graphs within a selected period.
- Enable date range selector: This feature allows users to filter the graphical data to view only information within a specific date range. When enabled, users can select the start and end dates for each graph above.
System Monitoring Graphs
These graphs show the usage of various system resources, such as CPU, RAM, Load, Partition, and SWAP memory. These graphs can be used to identify performance bottlenecks and troubleshoot problems.
CPU
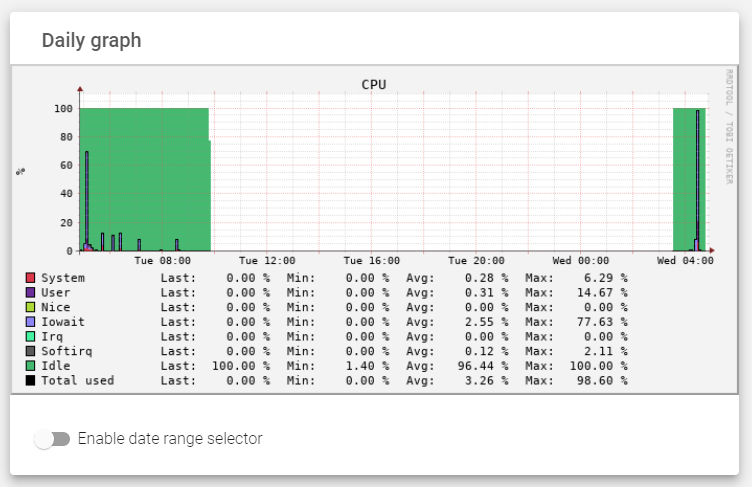
The CPU graph includes the following properties:
- System: Monitors the usage of kernel space processes, such as L4 farms and network drivers.
- User: Monitors the percentage of CPU that is being used by normal processes in the userspace, such as HTTP/S load balancer cores and the administration web server.
- Nice: Monitors the usage of prioritized processes in the system.
- Iowait: Monitors the usage of I/O tasks, such as disk and networking.
- Irq: Monitors interruptions to the main CPU.
- Softirq: Monitors short interruptions to the main CPU.
- Idle: Monitors the percentage of resources that are not being used by the system.
- Total used: Monitors the total amount of resources that are being used by the system.
- %: The percentage of CPU resources utilized by the appliance. This is the vertical axis of the CPU graph, and it is indexed after every 20th percentage.
Load
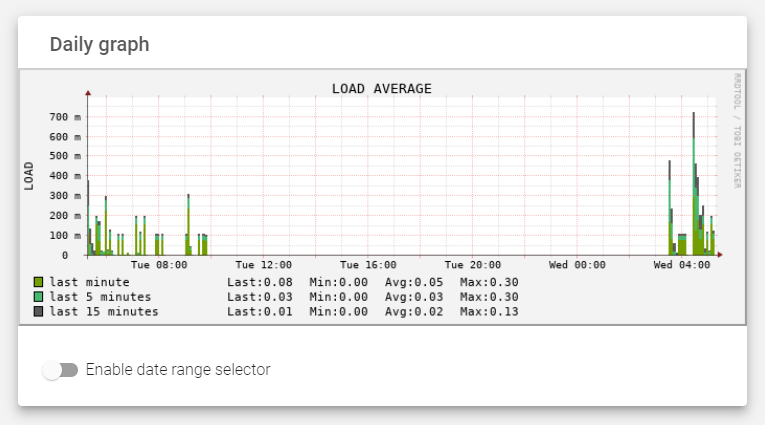
The Load graph includes the following properties:
- Last minute: The number of core resources used in the last 1 minute.
- Last 5 minutes: The number of core resources used in the last 5 minutes.
- Last 15 minute: The number of core resources used in the last 15 minutes.
- Load: Vertical axis of the LOAD graph, indexed every 100 MB
RAM
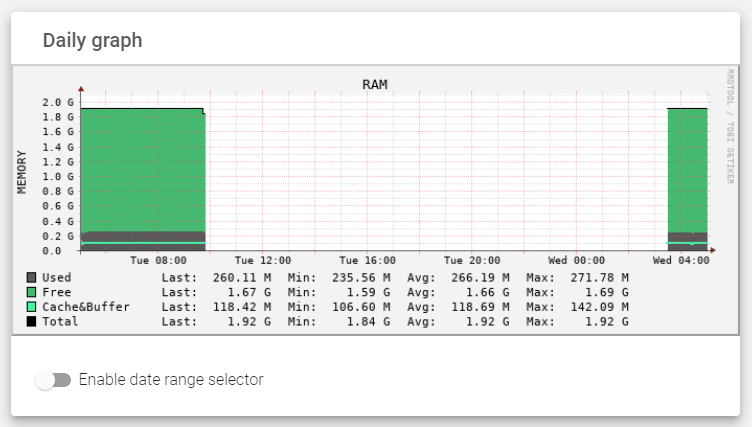
The RAM graph includes the following properties:
- Used: Monitors the memory that is not available and is used by the kernel and processes in the system.
- Free: Monitors the memory that is available in the system.
- Cache: Monitors the volatile memory that aids processor speeds.
- Buffer: Monitors the memory that is used for balancing information speed between different processes.
- Memory: Vertical axis of the RAM graph, indexed every 0.2 GB
SWAP
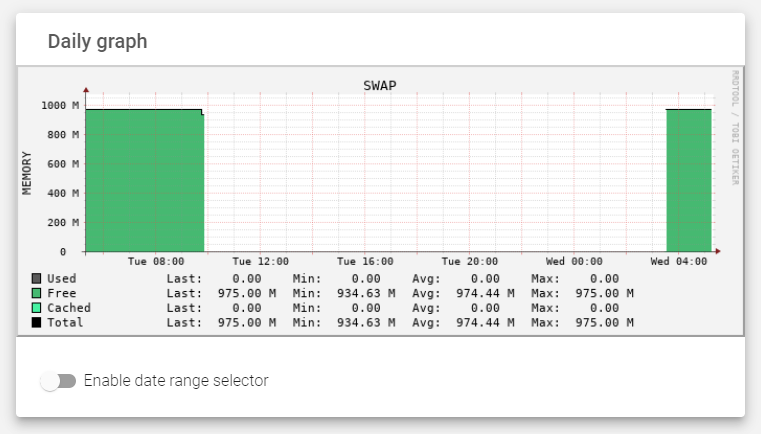
The SWAP graph includes the following properties:
- Used: The amount of Swap memory used by the appliance.
- Free: The amount of Swap memory Available for use by the appliance.
- Cached: The volatile that stores swapped-out pages that are still in use.
- Total: Monitors the total amount of swap memory used by the appliance.
- Memory: Vertical axis of the SWAP graph, indexed every 200 MB
Partition
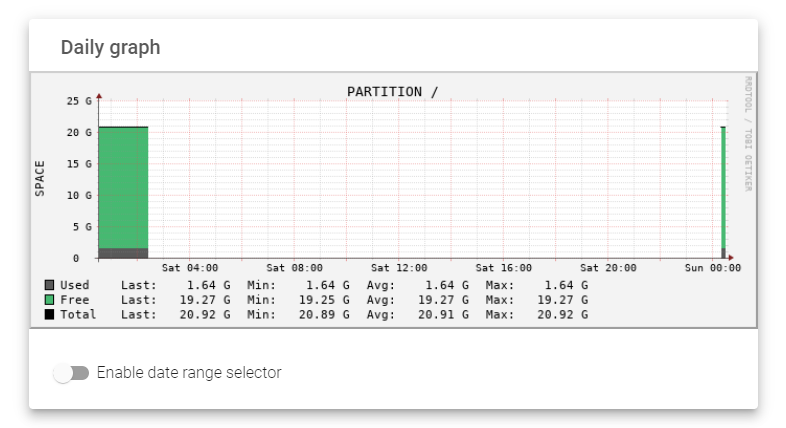
The Partition graph includes the following properties:
- Used: The amount of Disk storage used by the appliance.
- Free: The amount of Disk storage not used by the appliance and is available for use.
- Total: The total amount of Disk storage allocated to the appliance.
- SPACE: Vertical axis of the Partition graph, index every 0.5 GB.
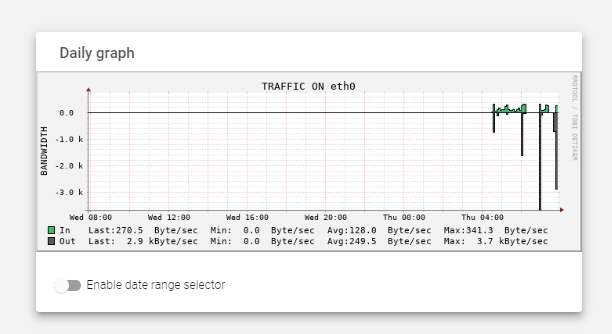
Interface Monitoring Graphs
These graphs and details show the input and output traffic for each physical and VLAN interface created in the load balancer.
- Input traffic: The amount of traffic that is being received by the interface.
- Output traffic: The amount of traffic that is being sent by the interface.
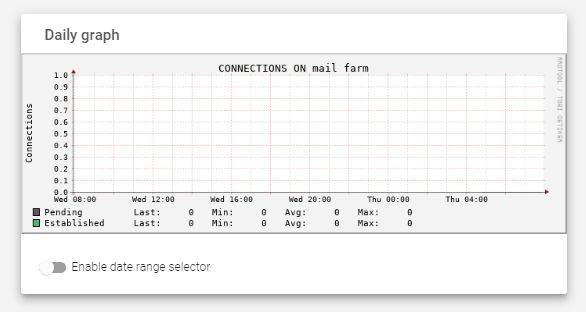
Farms Monitoring Graphs
These graphs and details show the number of connections for each farm or load balancing service created in the load balancer. The connections are divided into two categories:
- Established: Connections that have been confirmed and are active.
- Pending: Connections that have been initiated but not yet confirmed.
Each page shows graphs of data collected every 20 minutes, for the past day, week, month, and year.
Next Article: Monitoring | Stats
