Contents
Overview
The goal of this article is to explain how to monitor SKUDONET system health and performance with Icinga version 2 monitoring system. Icinga is an open-source computer system and network monitoring application. It was originally created as a fork of the Nagios system monitoring application in 2009.
In this document we’ll use Icinga to monitor system health and performance of a SKUDONET ADC Load Balancer appliance (previously ZEVENET).
Explaining Icinga Server installation & setup is out of the scope of this document. You can refer to Icinga official documentation https://icinga.com/docs/.
Conventions
We’ll use the following conventions in this document:
| Name | Value |
| Icinga Server IP address | monitor.icinga.com |
| Icinga Server Web Interface URL | http://monitor.icinga.com |
| SKUDONET ADC Load Balancer appliance IP address | SKUDONET-IP |
SKUDONET (previously ZEVENET) Monitoring Plugins
SKUDONET Monitoring Plugins is a collection of Nagios plugins written in Perl to monitor SKUDONET ADC Load Balancer Enterprise Edition system health and performance metrics.
| Plugin | Check | Provided performance data |
|---|---|---|
| check_Skudonet_farm.pl | Farm status | Established and pending connections to the farm |
| check_Skudonet_farm_backend.pl | Backend status | Established and pending connections to the backends |
SKUDONET Monitoring Plugins are developed to be installed in your Icinga (Or Icinga plugin’s compatible like Nagios, Naemon, Shinken, Sensu, and other monitoring applications.) monitoring server. So please access via SSH to
your monitoring host as root to install the required software.
Install dependencies
Install required perl modules:
Debian Buster:
apt update && apt install libwww-perl libjson-perl libmonitoring-plugin-perl libswitch-perl
If Perl modules don’t exist in your distribution package manager, then you can install manually:
Other distributions:
cpan install LWP::UserAgent'
cpan install Monitoring::Plugin'
cpan install JSON'
cpan install Switch'
Grab latest version
Download from here.
wget https://github.com/skudonet/zevenet-monitoring-plugins/archive/master.zip
unzip zevenet-monitoring-plugins-master.zip
Copy check scripts
cd zevenet-monitoring-plugins-master
cp -r libexec/* /usr/lib/nagios/plugins/
Create a SKUDONET API v4 key
Login into SKUDONET web interface and go to System > Users > Edit API user > Generate random key, we’ll use this key as an authentication method to retrieve the metrics from SKUDONET ADC Load Balancer appliance. Finally make sure the API user is active.
Test plugin manually
cd /usr/lib/nagios/plugins/
./check_skudonet_farm.pl -H SKUDONET-IP -z monitorkey -f ReverseProxy -w 20,20 -c 25,25
Example output:
ZEVENET OK - profile='https' farm='ReverseProxy' listen='SKUDONET-IP:SKUDONET-Port' status='up' (established_connections='10') (pending_connections='0') | established_connections=10;20;25 pending_connections=0;20;25
Add command definitions to Icinga
See Icinga command definitions example file in “icinga/icinga_commands.cfg” .
You can add the command definitions to your Icinga configuration:
cd skudonet-monitoring-plugins/icinga/
cat icinga_commands.cfg >> /usr/share/icinga2/include/command-plugins.conf
Add service definitions to Icinga
See Icinga service definitions example file in “icinga/icinga_services.cfg” .
You can add the service definitions to your Icinga configuration:
cd skudonet-monitoring-plugins/icinga/
cat icinga_services.cfg >> /etc/icinga2/conf.d/services.conf
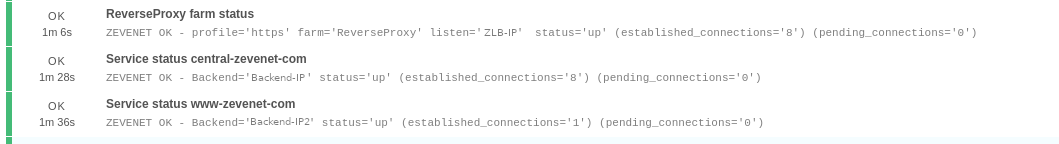
Restart Icinga and have fun!
Restart Icinga process and access Icinga web interface to see the services you have just created.
/etc/init.d/icinga2 restart
NRPE
You can use the check_nrpe plugin from the NRPE project to query the NRPE daemon or the Icinga client. Icinga 2 doesn’t provides the nrpe check command for this anymore.
Add command definitions to Icinga
See Icinga service definitions example file in “nrpe/nrpe_services.cfg” .
You can add the service definitions to your Icinga configuration:
cd Skudonet-monitoring-plugins/nrpe/
cat nrpe_services.cfg >> /etc/icinga2/conf.d/services.conf
Add command definitions to SKUDONET
See NRPE command definitions example file in “nrpe/nrpe_commands.cfg” .
You can add the command definitions to your NRPE configuration:
cd Skudonet-monitoring-plugins/nrpe/
cat nrpe_commands.cfg >> /etc/nagios/nrpe.cfg
Restart NRPE and Icinga and have fun!
Restart NRPE process and Icinga process and access Icinga web interface to see the services you have just created.
Execute command in SKUDONET Load Balancer:
/etc/init.d/nagios-nrpe-server restart
Execute command in Icinga:
/etc/init.d/icinga2 restart
