The GSLB Farm Stats Graphs section shows monitoring graphs and the history of Established and Pending connections for the active farm over four different time frames: Daily, Weekly, Monthly, and Yearly.
View these stats by clicking the Show Graphs button as shown in the image below.
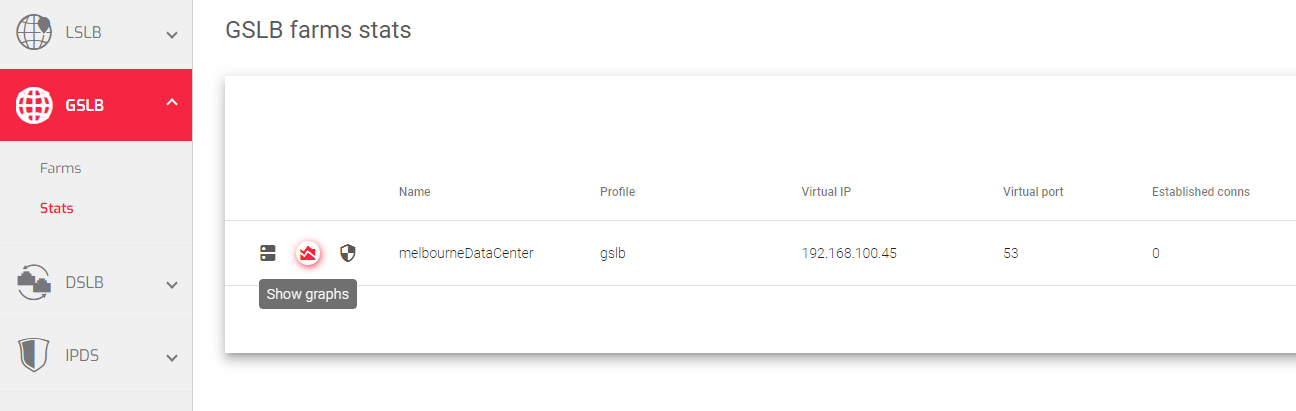
These are graphs showing the connections on each of the GSLB Farms.
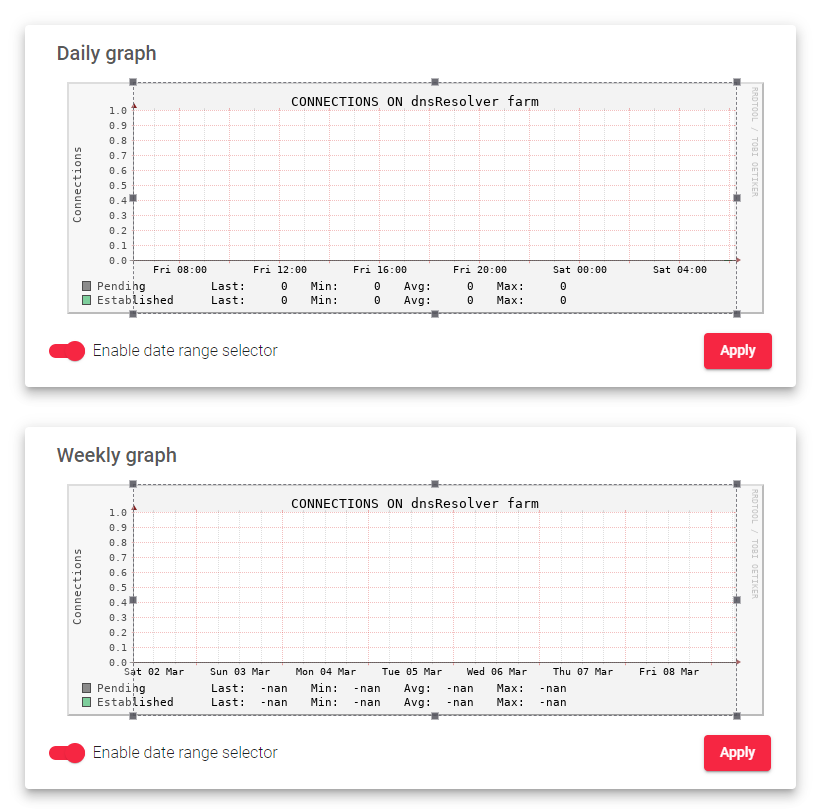
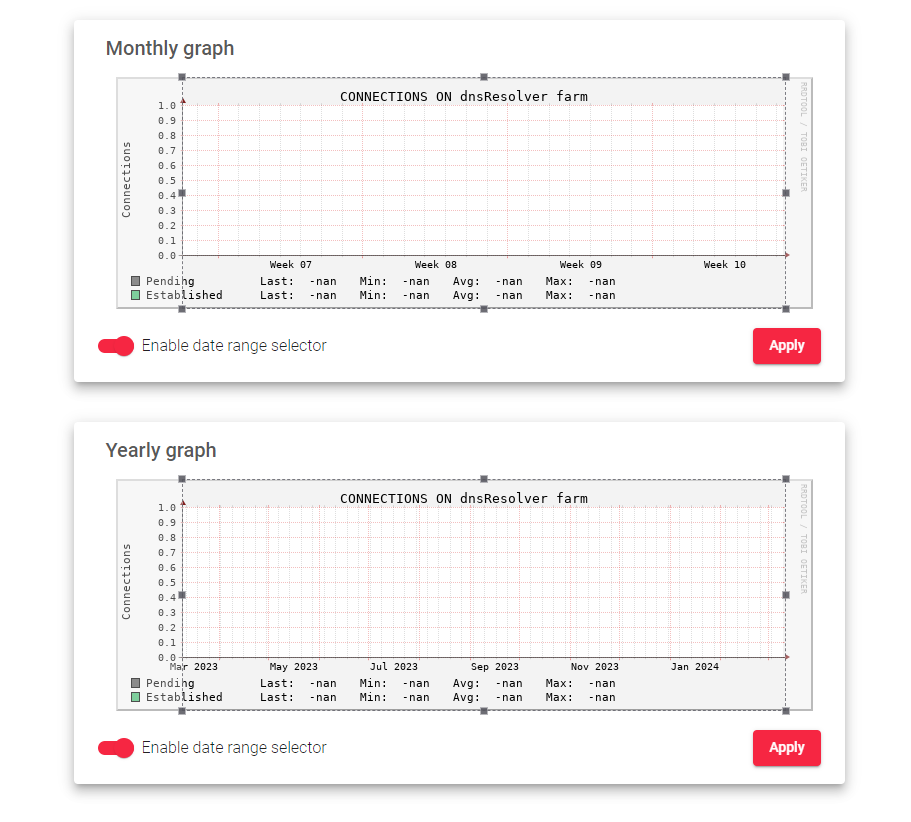
Here is an overview of the connections on the graphs:
- Established: Confirmed connections that are marked as ESTABLISHED. For GSLB farms, this means that the DNS requests are receiving responses from the backends.
- Pending: Connections to the GSLB farm that have not received a response from the backends yet. An increased rate of pending connections means that more requests are not being served.
Each graph also indicates the following values:
- Last: The last value gathered.
- Minimum: The minimum value.
- Maximum: The maximum value.
- Average: The average value.
Enable data range selector: Activate this toggle to choose a specific date range for displaying the statistics.
Next Article: GSLB | Stats | Backends
