
Farmguardian
Farmguardian is a tool that helps you monitor the health of the servers that your load balancer uses to distribute traffic. It can detect problems such as unresponsive servers or servers that are returning errors. When Farmguardian detects a problem, it can automatically disable the affected server to prevent it from sending traffic to clients.
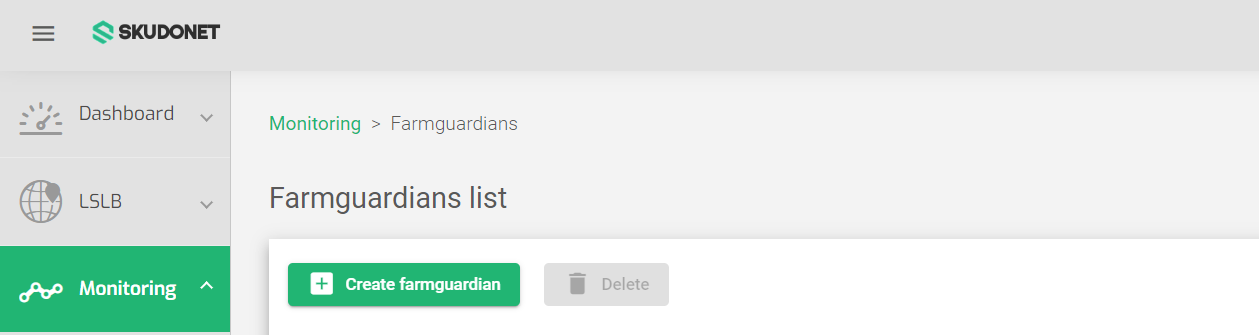
The Farmguardian section of the load balancer web interface shows you a list of all the health checks that you can use to monitor your servers. It also tells you what each check does and which farms it is applied to.
Types of Health checks
There are two types of health checks:
- pre-configured: Are built into the load balancer and you cannot change them.
- custom: Can be created and modified by you.
To tell the difference between a pre-configured and a custom health check, look at the Actions column.
If the configuration setting for a health check is grayed out, it is a pre-configured check. If the configuration setting has a pencil icon next to it, it is a custom check.
Farmguardian Actions
- Create Farmguardian: Create a new health check.
- Delete: Delete a selected health check.
Farmguardian Table Descriptions
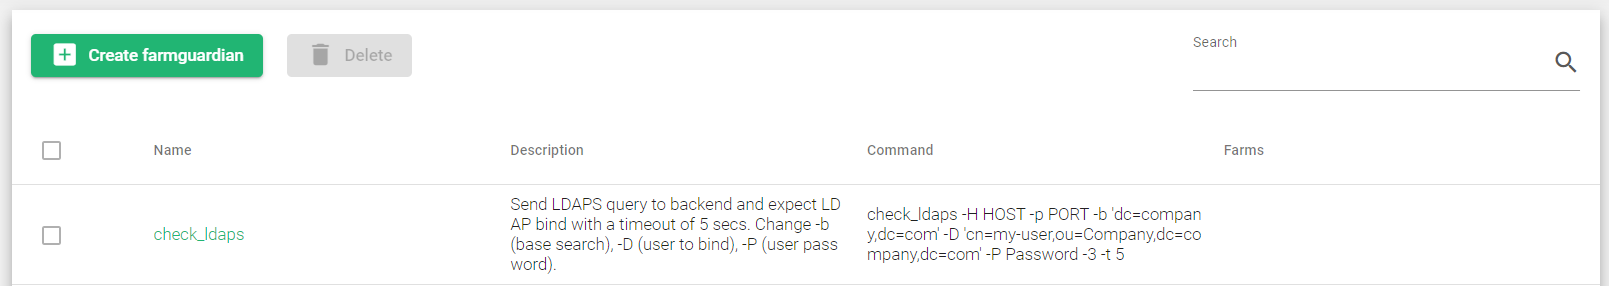
Here is a brief description of each field in the above table
Name: A descriptive name for the health check.
Description: What the health check does.
Command: The command that is used to check the health of the backends.
Farms: The farms and services that use the health check.
Actions: What you can do with the health check:
- Edit: Change the configuration of the health check. This is only available for custom health checks.
- Delete: Delete the health check. If the health check is assigned to any service, you will be prompted to confirm whether you want to force the deletion. This action is only available for custom health checks.
Pre-configured health checks
Use the following health checks that are already built into the system to monitor your farm.
| Health Check | Description |
|---|---|
| check_redis | Checks if the Redis server is in master role. If it is not, the backend will be marked as DOWN. |
| check_tcp | Sends TCP connections to the backend. |
| check_udp | Sends UDP packets to the backend and checks if the port is open. |
| check_http | Sends HTTP requests to the backend and expects a 200 OK response within 5 seconds. |
| check_https | Sends HTTPS requests to the backend and expects a 200 OK response within 5 seconds. |
| check_smtp | Sends SMTP connections to the backend and expects an SMTP OK response within 5 seconds. |
| check_https_response_string | Sends HTTPS requests to the backend and expects a 200 OK response and a given string in the HTML within 5 seconds. The string is also changed by value to find the response. |
| check_http_response_string | Sends HTTP requests to the backend and expects a 200 OK response and a given string in the HTML within 5 seconds. The string is also changed by value to find the response. |
| check_pop | Sends POP connections to the backend and expects a POP OK response within 5 seconds. |
| check_ldap | Sends LDAP queries to the backend and expects LDAP binds within 5 seconds. The base search, user to bind, and user password can be changed. |
| check_ldaps | Sends LDAPS queries to the backend and expects LDAP binds within 5 seconds. The base search, user to bind, and user password can be changed. |
| check_imap | Sends IMAP connections to the backend and expects an IMAP OK response within 5 seconds. |
| check_sip | Tests a SIP server/device for availability and response time. |
| check_ping | Sends 2 ICMP packets and checks to confirm the percentage of packets reaching the client. |
| check_common | Checks the folder usr/lib/nagios/plugins, which includes more checks. For more information about a health check, use the –help option. |
Next Article: Monitoring | FarmGuardian | Create
